
5. Managing the Cluster Containing all the Application Server Instances, by Using the Management Tool
NOT AVAILABLE IN SAAS
After installing and configuring the Management Tool for each instance of the Application Server, and logging in as a user with administrative permissions, click the Configuration (.png?inst-v=362ca448-a20b-4783-93c2-f49186888f5c)
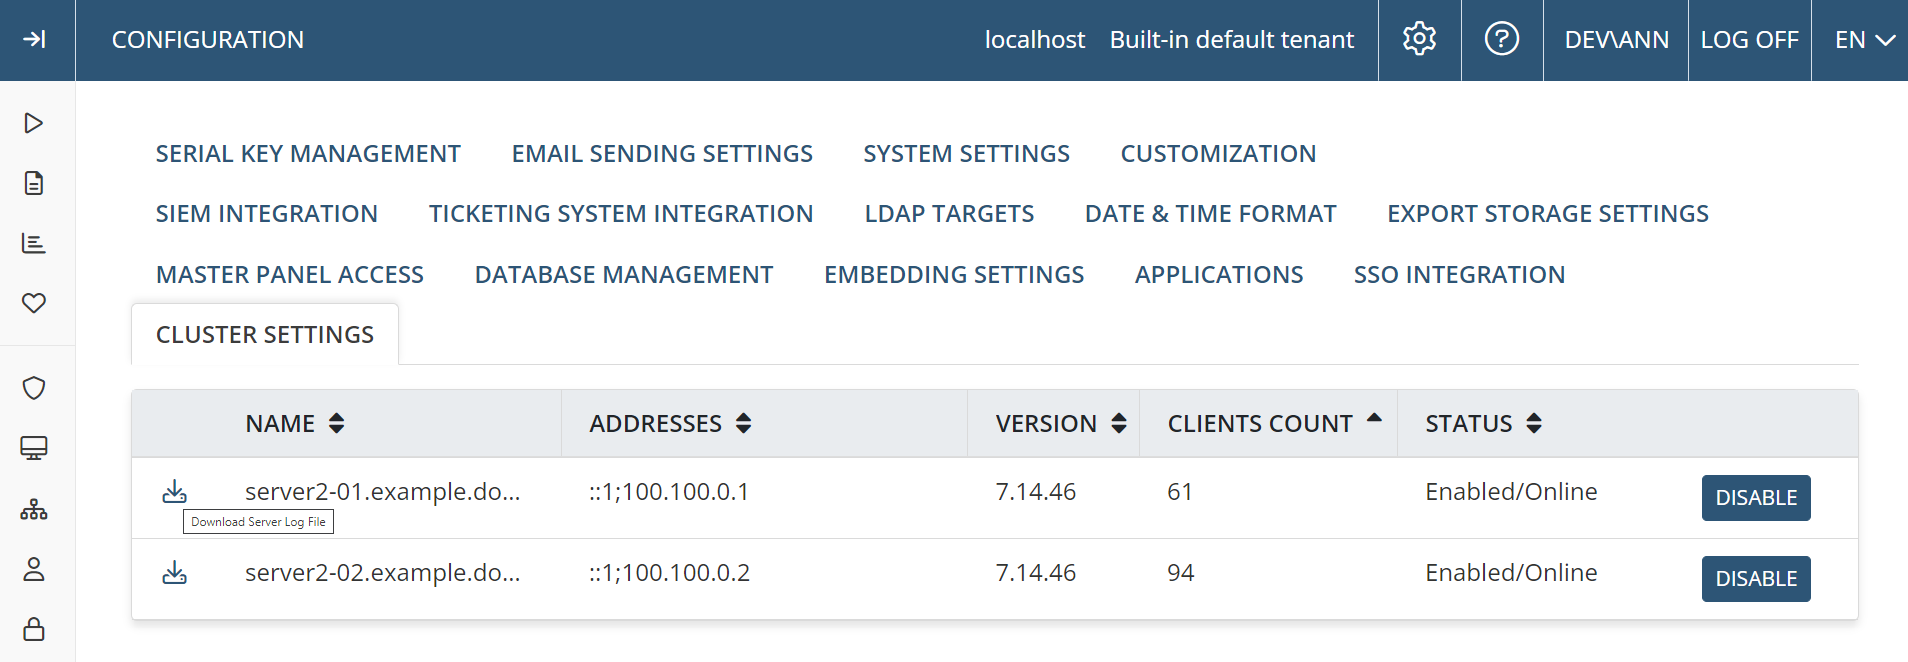
Here, you can view a list of all the Application Server instances in your Syteca deployment when using load balancing in High Availability mode.
For each Application Server, you can see how many Clients (in the Clients Count column) are currently connected to it (i.e. the load), as well as perform various other actions for each Application Server instance, such as:
• Viewing the Status of the Application Server.
• Putting the Application Server into Isolation mode (e.g. for system maintenance), by clicking the corresponding Disable button.
• Viewing the Syteca Version number of the Application Server (which will be useful when you need to update your entire deployment to a new version of Syteca).
• Downloading the Application Server logs (if the Application Server is online), by clicking the corresponding 
NOTE: On the Client Management page, the name of the Application Sever that each Client is connected to is also displayed in the Node column (as well as in the Node filter) when the Client is online and used in High Availability mode.
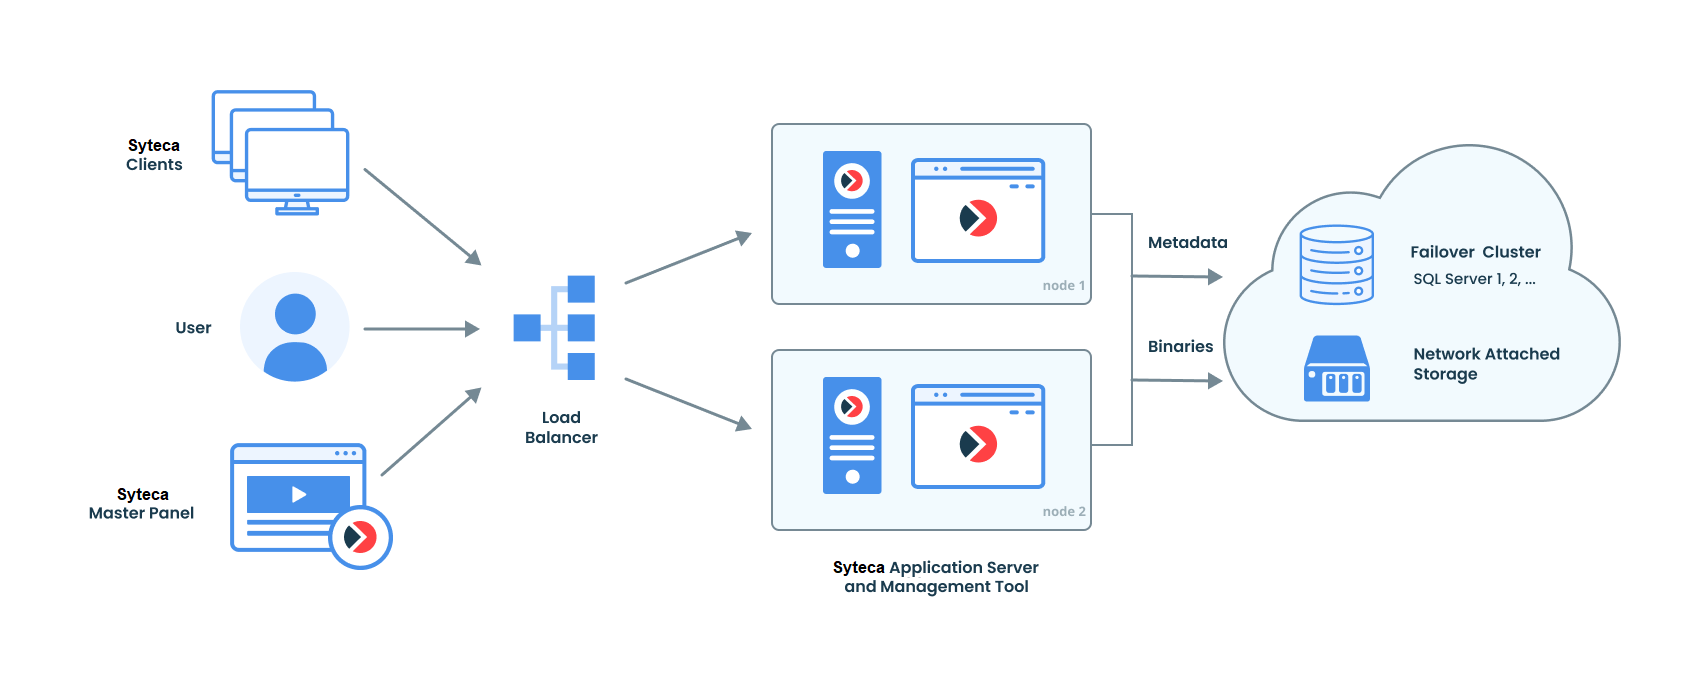
In conclusion, when you have your third-party load balancing software and the following set up (as shown in the deployment diagram below), then:
1. All your Clients are connected to the load balancer.
2. All your Application Servers are connected to the load balancer.
NOTE: You can integrate your load balancer with the healthcheck endpoint on every Application Server instance to check whether they are all accessible and responding correctly.
Use the following URL on all of your Management Tools: https://<The path to your Management Tool>/EkranSystem/healthcheck?debug=True
A response with the status code 200 (Successful) indicates that everything is working correctly, whereas the status code 50x (Service unavailable) may mean that the Application Server is stopped.
3. All your Application Servers are connected to your Syteca database.
4. Each Application Server is connected to its own Management Tool.
You can now use any of the Management Tools in the same way, to view the same information about all the Clients and their Sessions on all of the Application Servers in a cluster at once. Furthermore, the Syteca Master Panel can also be used to view all the information about all the Application Servers in all clusters at the same time in a single interface, including all the Clients and Sessions on all the Application Servers.