
4. Connecting the Master Panel to the Syteca Deployments
NOT AVAILABLE IN SAAS
Having installed the Master Panel, you are now ready to configure it, so as to connect it to each of your Management Tools.
To configure the Master Panel, do the following:
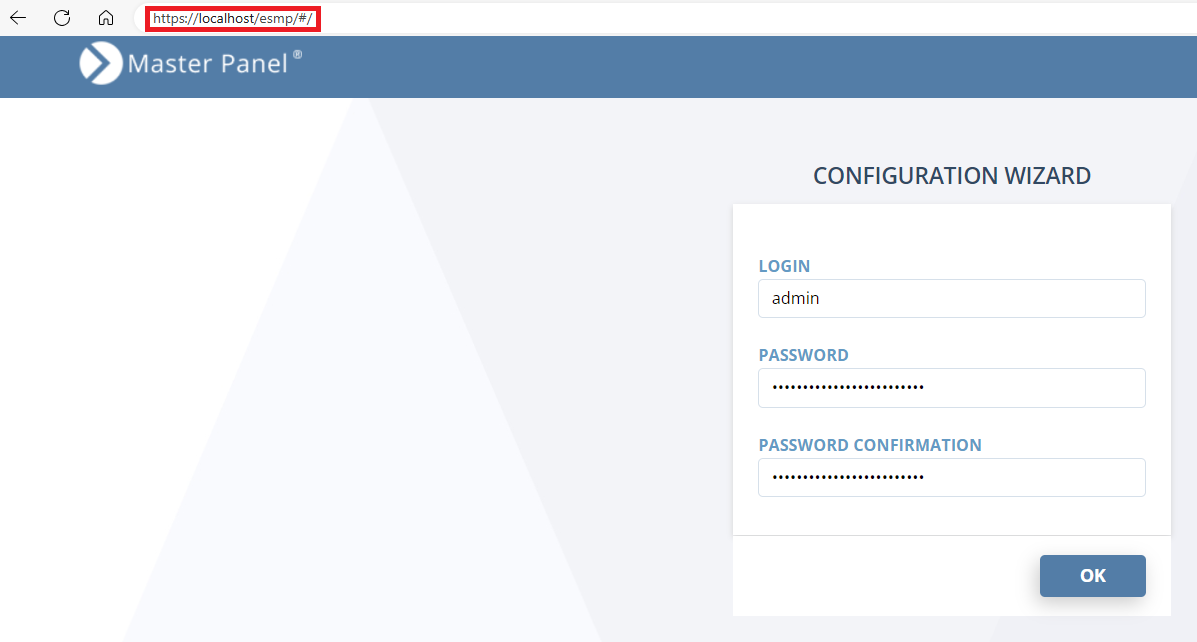
1. On the computer where you installed the Master Panel, open it by entering the following URL into your browser address bar: https://localhost/esmp/#/
NOTE: If you need to open the Master Panel from another computer, replace “localhost” in the URL with the IP address or hostname of the computer where the Master Panel is installed.
NOTE: If you need to use a secure HTTPS connection for accessing the Master Panel from other computers, please refer to the Syteca Quick Start Deployment Guide to see how to set up an HTTPS binding for the default website.
2. On the first startup of the Master Panel, the Configuration Wizard will open. First, enter a password to be used for the “admin” user account Login in both the Password and Password Confirmation fields, and then click the OK button.
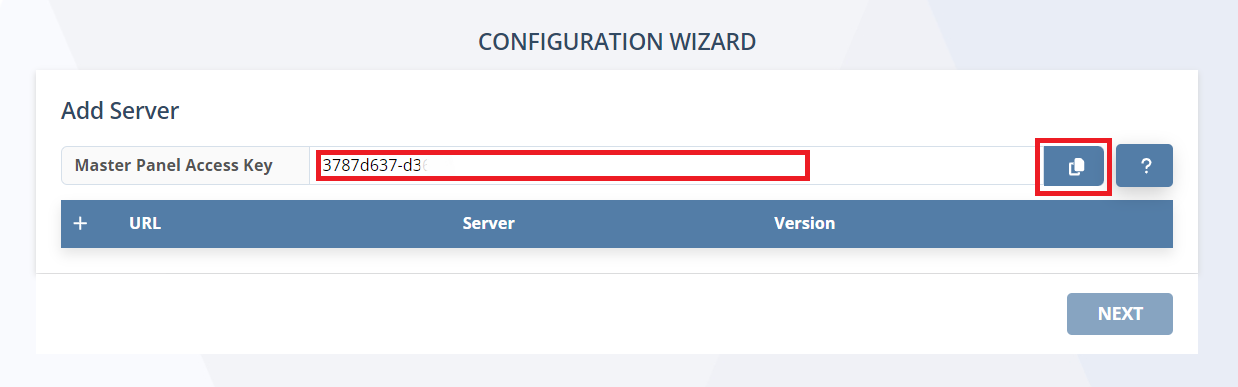
3. Copy the Master Panel Access Key (which can be done by clicking the Copy (
4. To connect the Master Panel to your Management Tools, in each Management Tool, do the following:
• Log in to the required Management Tool as a user with the following administrative permissions:
- Tenant Management and System Configuration
- Management Tool Access
• Click the Configuration (.png?inst-v=362ca448-a20b-4783-93c2-f49186888f5c)
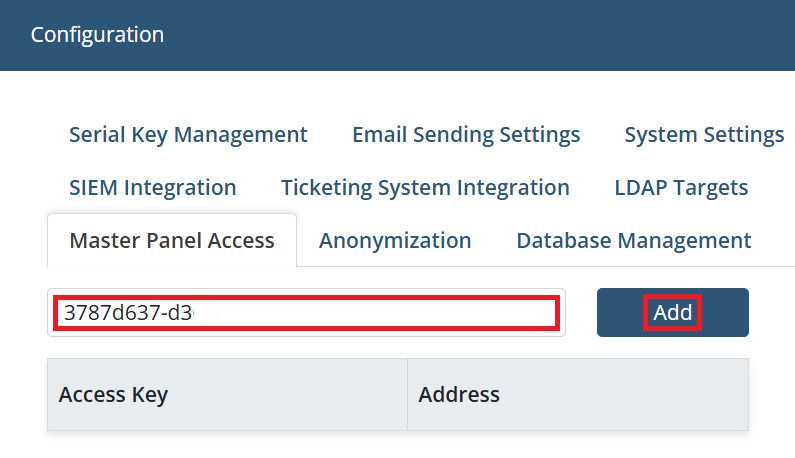
• On the Configuration page that opens, select the Master Panel Access tab, and paste the Access Key that you copied from the Master Panel into the empty field, and then click the Add button (to the right of it).
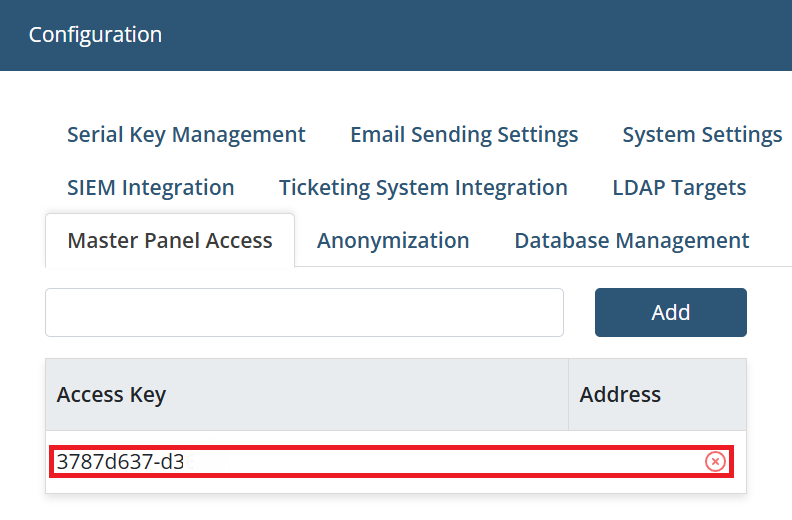
• The Access Key is then added to the bottom of the Access Key list (and can be removed at any time by clicking the 
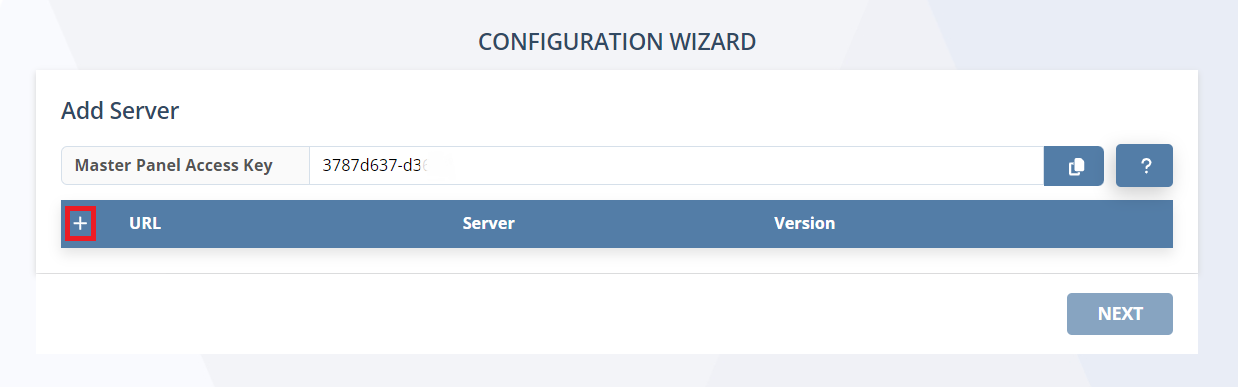
5. Switch back to the Master Panel Configuration Wizard, and for each Management Tool to be connected to the Master Panel, do the following:
• Click the “+” button (on the left of the URL column header).
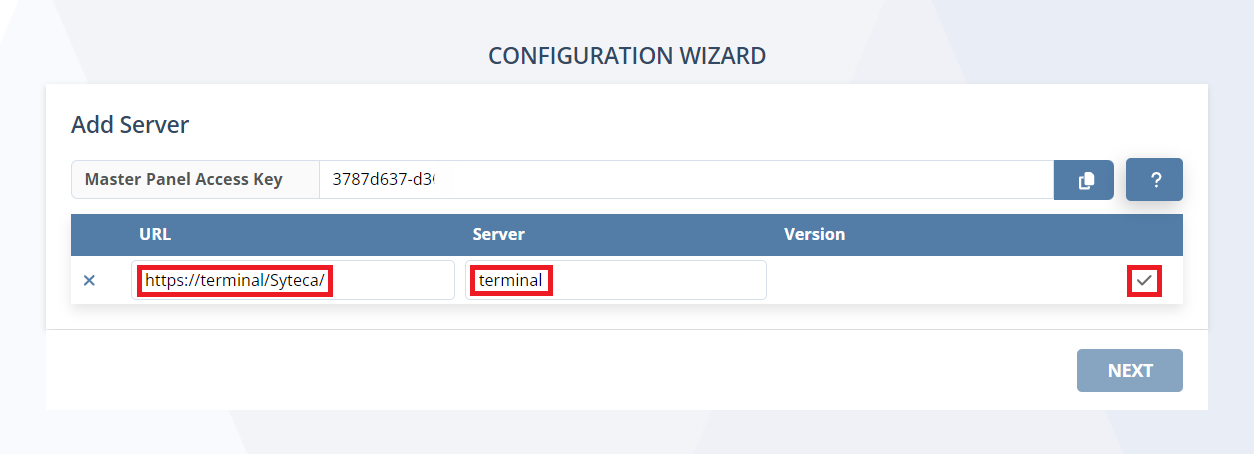
• Enter the URL of the Management Tool in the URL field in the format “https://<hostname>/<Path_to_the_Management Tool>" (e.g. "https://terminal/Syteca”), and enter a unique name for it in the Server field, and then click the check mark (
NOTE: For the URL, the hostname (or IP address) is that of the computer where the Management Tool is installed.
• This Management Tool is now added to the list of Management Tools which the Master Panel is connected to.
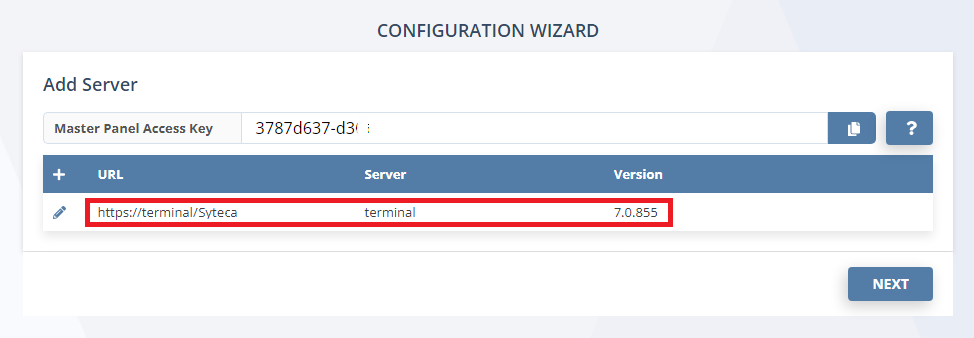
6. When the Master Panel has been connected to all the required Management Tools, click the Next button (in the bottom right).
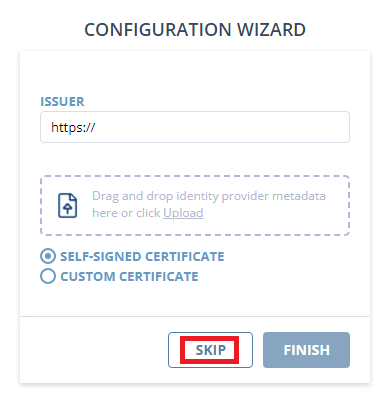
7. Click the Skip button (unless you want to configure SSO (single-sign-on) authentication for the Master Panel, which can also be configured at any time later, and is done in a similar way to configuring SSO authentication for the Management Tool, and must be configured in both the Master Panel and in all the Management Tools (deployments) that it is connected to).
8. The Master Panel is now configured and ready to be used.
9. If you need to modify the Master Panel configuration or connect the Master Panel to other Management Tools, you can simply log in to the Master Panel as the “admin” user at any time, and make the required changes in a similar way to that described above. When you have finished, click the “Admin” user name displayed in the top right of the page, and then select Log out in the drop-down menu.
NOTE: In the drop-down menu, apart from logging out, you can also download the Master Panel logs, and change the settings (i.e. change the "admin" password, and configure SSO authentication).
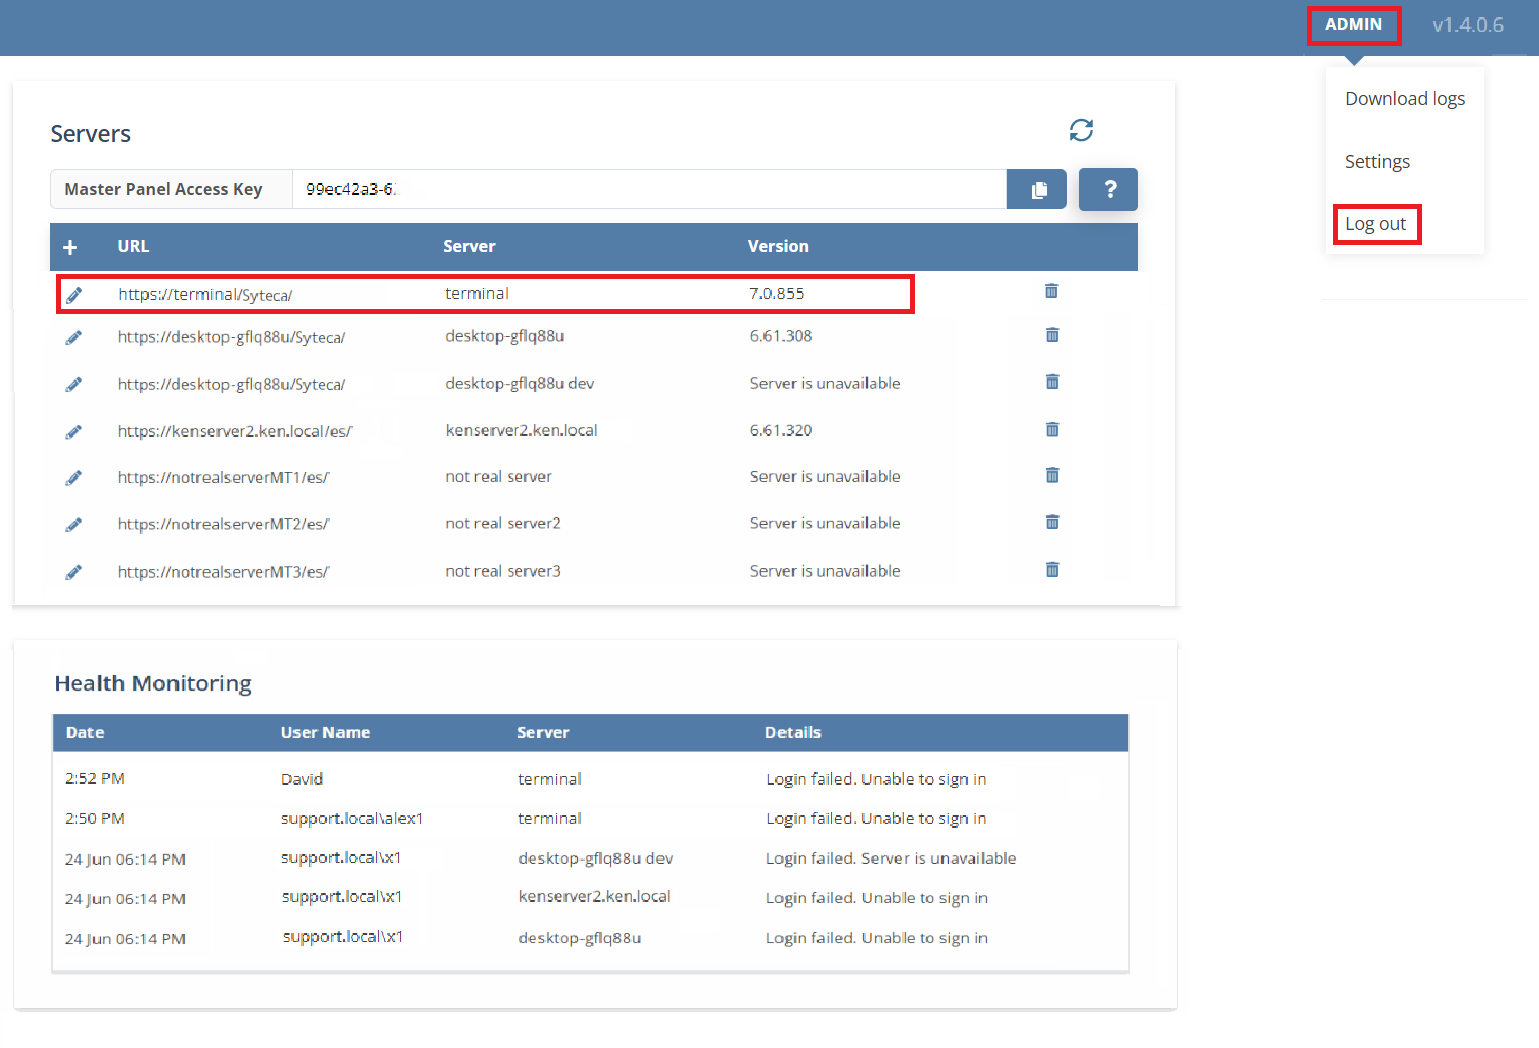
In the Servers grid (at the top of the page), the following buttons are available and can be used to:
• The Refresh ( 
• The Pencil ( 
• The Trash can ( 
In the Health Monitoring grid (at the bottom of the page), a list of any issues that have occurred with any of the Management Tools (or the corresponding Syteca Application Servers) is displayed in the Details column, either:
• "Login failed. Server is unavailable": e.g. if Syteca Application Server is stopped, or the connection to it (or the connection to the corresponding Management Tool) has been lost, etc.
• "Login failed. Unable to sign in": e.g. if the user does not have the required permissions to log in, or the user account does not exist, etc.