Syteca Client Logs
To download the Client Log files from the Management Tool, open the Client Management page, and select the checkboxes next to the required Clients, and then click the Bulk Action (
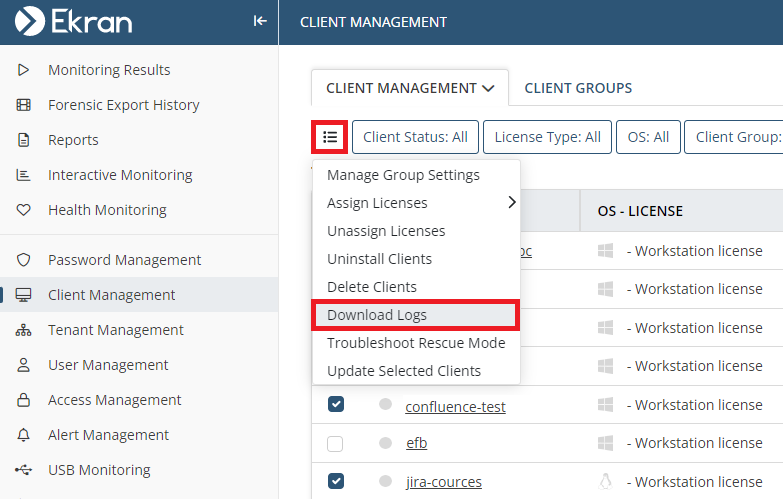
NOTE: Log files can only be downloaded for Clients that are currently online.
If you do not have access to the Management Tool, or the Client computer if offline, you can alternatively collect the logs on the computer where the required Client is installed as described below.
Table of Contents
1. Windows Client Logs
The Windows Client logs are stored locally on the Client computer in the following folder: C:\Program Files\Ekran System\Ekran System\ClientLogs
2. Linux Client Logs
To collect the Syteca Linux Client logs locally on the Client computer, do the following:
1. Run the Terminal.
2. Use the following command to open the folder where you can find the getenv.sh tool, which can then be used to create the Client logs locally: cd /opt/.Ekran
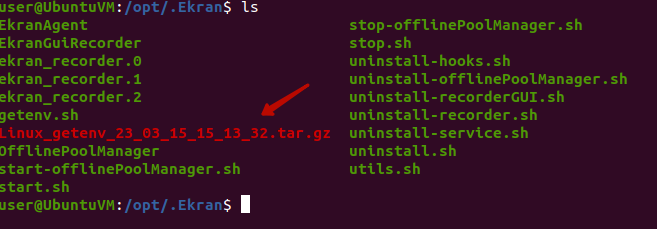
3. Run the getenv.sh tool, and use the following command to create an archive containing the logs: sudo ./getenv.sh
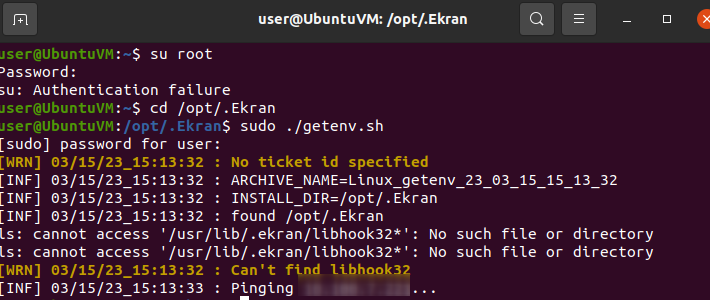
4. The archive containing the logs is then created in the same /opt/.Ekran folder.
Additionally, 2 other separate Client log files are located in a different folder:
1. LoginsLogouts.log: Contains information on all remote ssh login/logout operations to/from the Client machine, and on whether the session is recorded or not. This log file is only created when using additional software for data collection (e.g. a SIEM system) where information is registered about user login/logout operations.
NOTE: The Syteca Linux Client does not collect any sensitive data, including user passwords.
This file containing the logs is located at: /var/.ekran/logs/LoginsLogouts.log
Each record in the log file contains the following data:
• The timestamp of the record.
• The user name.
• The event (start/finished/killed).
• The type of session (ssh/sftp/scp).
• Whether the session is recorded (or not) by the Syteca Client.
NOTE: This log file also contains records of when sessions started. For sessions monitored by the Syteca Client, the logs also contain records of when the session finished or when the appropriate recorder was forcibly killed. “scp” and “sftp” sessions are not supported by the Syteca Client, and are therefore marked as “Will not be recorded”.
2. rescue.log: Contains information about Linux Client Rescue mode (for more information about Rescue mode, please refer to the The Linux Client Status after an Application Server Update page).
This file containing the logs of Rescue mode activation times is located at: /var/.ekran/logs/rescue.log
Each record in the log file contains the following data:
• The timestamp of the record.
• The hostname.
• The user name.
• The PID (Process ID) of the recorder that caused the Client to go into Rescue mode.
• The timestamp of the event that triggered the Client computer to go into Rescue mode.
• The reason that the Client computer went into Rescue mode.
NOTE: This log file also includes records of when the Client came out of Rescue mode.
3. macOS Client Logs
The collect the macOS Client logs locally on the Client computer, do the following:
1. Run the Terminal application.
2. Use the following command to open the folder where you can find the pack_agent_data.sh tool, which can then be used to create the Client logs locally in: open /Libraries/Applications\ Support/ Ekran
3. Run the pack_agent_data.sh tool to create an archive containing the logs.
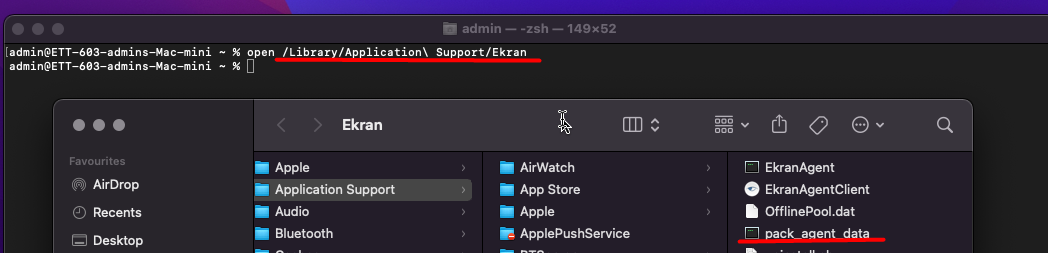
4. The archive containing the logs is then created on the desktop.

4. Log Levels
To define the level of the log entries to be saved to the Client log files, open the Client Management page, click on the name of the required Client computer, and then on the Editing Client page, select the Properties tab, and scroll down to the Diagnostics section (at the bottom).
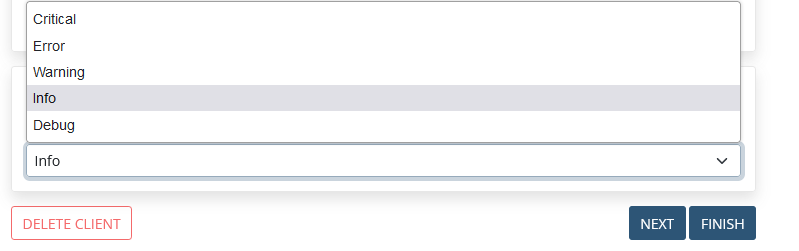
Syteca Client logs should be defined to have any of the following 4 log severity levels:
• Error: The system records all Client critical (i.e. FATAL) and non-critical error events in the log files. The log level value is 1.
• Warning: The system records all Client warning events and critical error events in the log files. The log level value is 2.
• Info: The system records all Client events, including all warning events and critical and non-critical error events in the log files. The log level value is 3.
• Debug: The system records all Application Server transactions in the log files. The log level value is 4.
If you do not have access to the Management Tool, you can change the log level locally by doing the following:
• For Windows Clients:
1. Open the Windows Registry Editor.
2. In the Registry Editor window, select the HKEY_LOCAL_MACHINE\SOFTWARE\EkranSystem\Client key.
3. Select Edit > New > DWORD (32-bit) Value, and add a new value:
• Value type: DWORD
• Value name: TraceLogLevel
• Value data: 3
Restart the EkranClient service to continue working with the application.
• For Linux Clients:
1. Run the Terminal.
2. Use the following command to open the folder, where you can find the settings.xml file: cd /etc/.ekran
3. Open the settings.xml file under a root account using a text editor (e.g. nano).
4. Change the AgentLogLevel value to the value required.
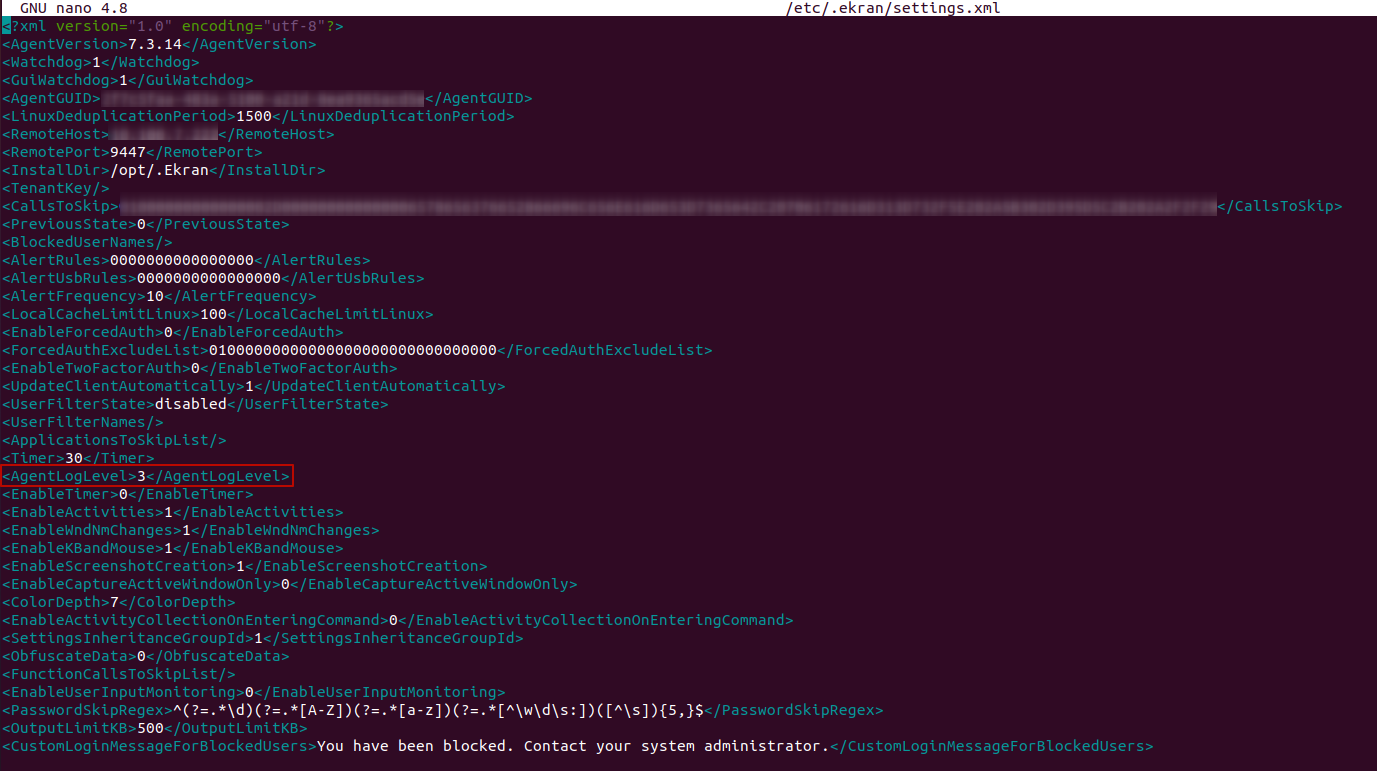
5. Save the changes.
6. Restart the Linux Client computer.
• For macOS Clients:
1. Run the Terminal application.
2. Use the following command to open the settings.xml file: sudo nano /opt/.Ekran/settings.xml.
3. Change the AgentLogLevel value to the value required.
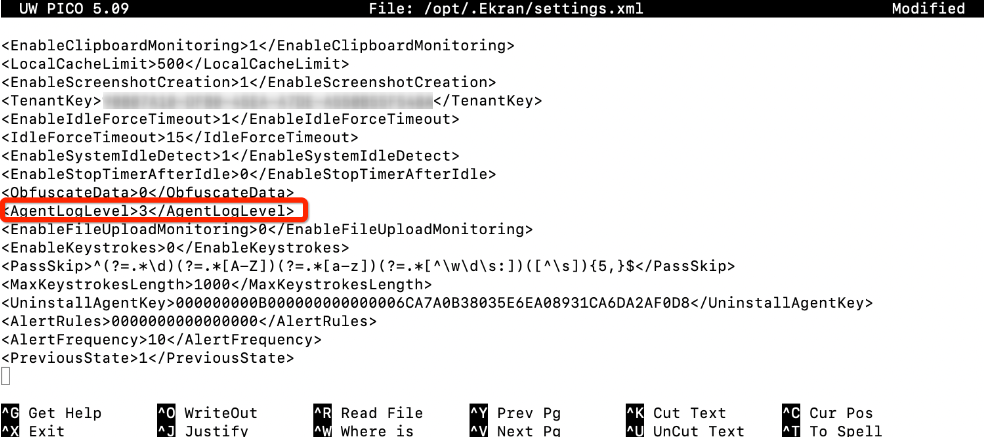
4. Restart the sytecad process.
NOTE: The log level on the macOS Client computer can be changed locally if there is no connection with the Application Server. If you change the log level locally and then restart the "sytecad" process, as soon as a connection to the Application Server is established, the settings will be changed to those in the Management Tool.
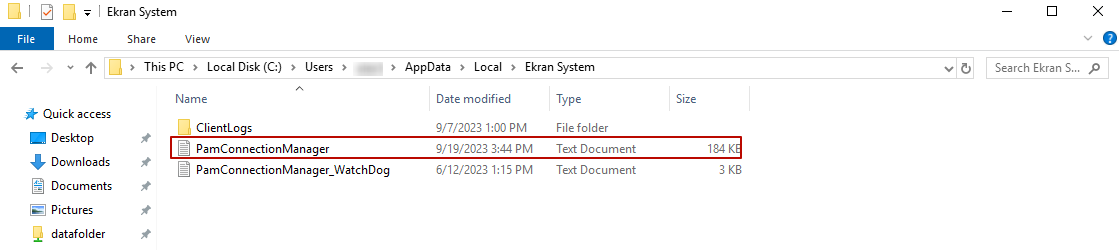
5. Syteca Connection Manager Logs
The Syteca Connection Manager logs can be found in the following folder: C:\Users\<user>\AppData\Local\Ekran System