
CPU Usage
NOT AVAILABLE IN SAAS
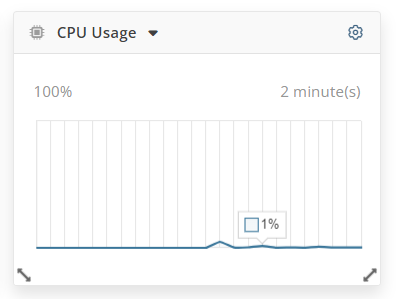
The CPU Usage dashboard contains a chart with statistics on CPU usage by the EkranServer process, displayed in percentage terms.
The dashboard is updated every five seconds.
The following settings can be configured for this dashboard, by clicking the cog (
• Chart color
To view this dashboard, you need to belong to the Administrators user group of the Built-in default tenant in Single-Tenant mode, or have the administrative Tenant Management and System Configuration permission in Multi-Tenant mode. If you do not have this permission, you will see an empty dashboard with a message saying that you do not have the permissions required for viewing this data. Also in this case, the dashboard will not be displayed in the drop-down list when clicking the Add button (in the top right of the page).