
Database State
NOT AVAILABLE IN SAAS
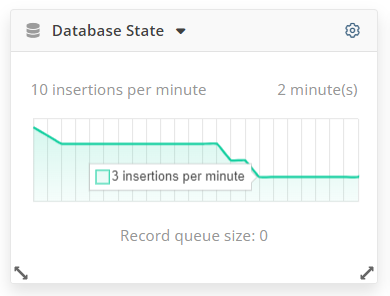
The Database State dashboard contains information on the average number of times a Client writes data to the database per minute.
Information about the number of records in the queue to be written to the database is displayed at the bottom of the dashboard.
NOTE: The maximum size of the queue is 64 records. If this limit is reached, Clients stop sending data to the Application Server and temporarily store it in the Client’s offline cache until the queue size decreases.
The following settings can be configured for this dashboard, by clicking the cog (
• Chart color
To view this dashboard, you need to belong to the Administrators user group of the Built-in default tenant in Single-Tenant mode, or have the administrative Tenant Management and System Configuration permission in Multi-Tenant mode. If you do not have this permission, you will see an empty dashboard with a message saying that you do not have the permissions required for viewing this data. Also in this case, the dashboard will not be displayed in the drop-down list when clicking the Add button (in the top right of the page).