
Storage Usage
NOT AVAILABLE IN SAAS
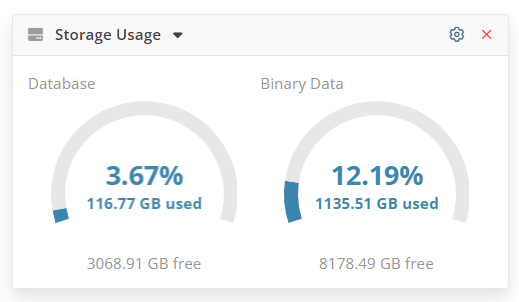
Depending on how binary data storage location is configured, the following information is displayed on the Storage Usage dashboard:
• If binary data is stored in an SQL database, the Database pie chart is displayed, which allows you to view statistics on the disk space used by the database (including binary data), together with the remaining free space.
• If binary data is stored in a shared or local folder, the Database and Binary Data pie charts are displayed. The Database chart allows you to view statistics on the disk space used only by the database (together with the remaining free space), while the Binary Data pie chart allows you to view statistics on the disk space used by the binary data (together with the remaining free space).
NOTE: If the database was created manually or the disk space is not automatically detected, to view statistics on the disk space, the available (i.e. allocated) disk space for the database in the dashboard settings first needs to be specified (see below).
The following settings can be configured for this dashboard, by clicking the cog (
• Critical free space size (GB): The free space limit at which you are alerted that available space is running low.
• Used storage size color: The color of the sector indicating how much storage space is currently used.
• Total storage size color: The color of the sector indicating how much storage space is currently still free (i.e. remains available for use).
• Warning storage size color: The color of the used storage sector when the amount of free space has fallen below the critical free space threshold.
• Disk space allocated for the database (GB): The available disk space for the database.
To view this dashboard, you need to have the administrative Database Management permission. If you do not have this permission, you will see an empty dashboard with a message saying that you do not have the permissions required for viewing this data. Also in this case, the dashboard will not be displayed in the drop-down list when clicking the Add button (in the top right of the page).