
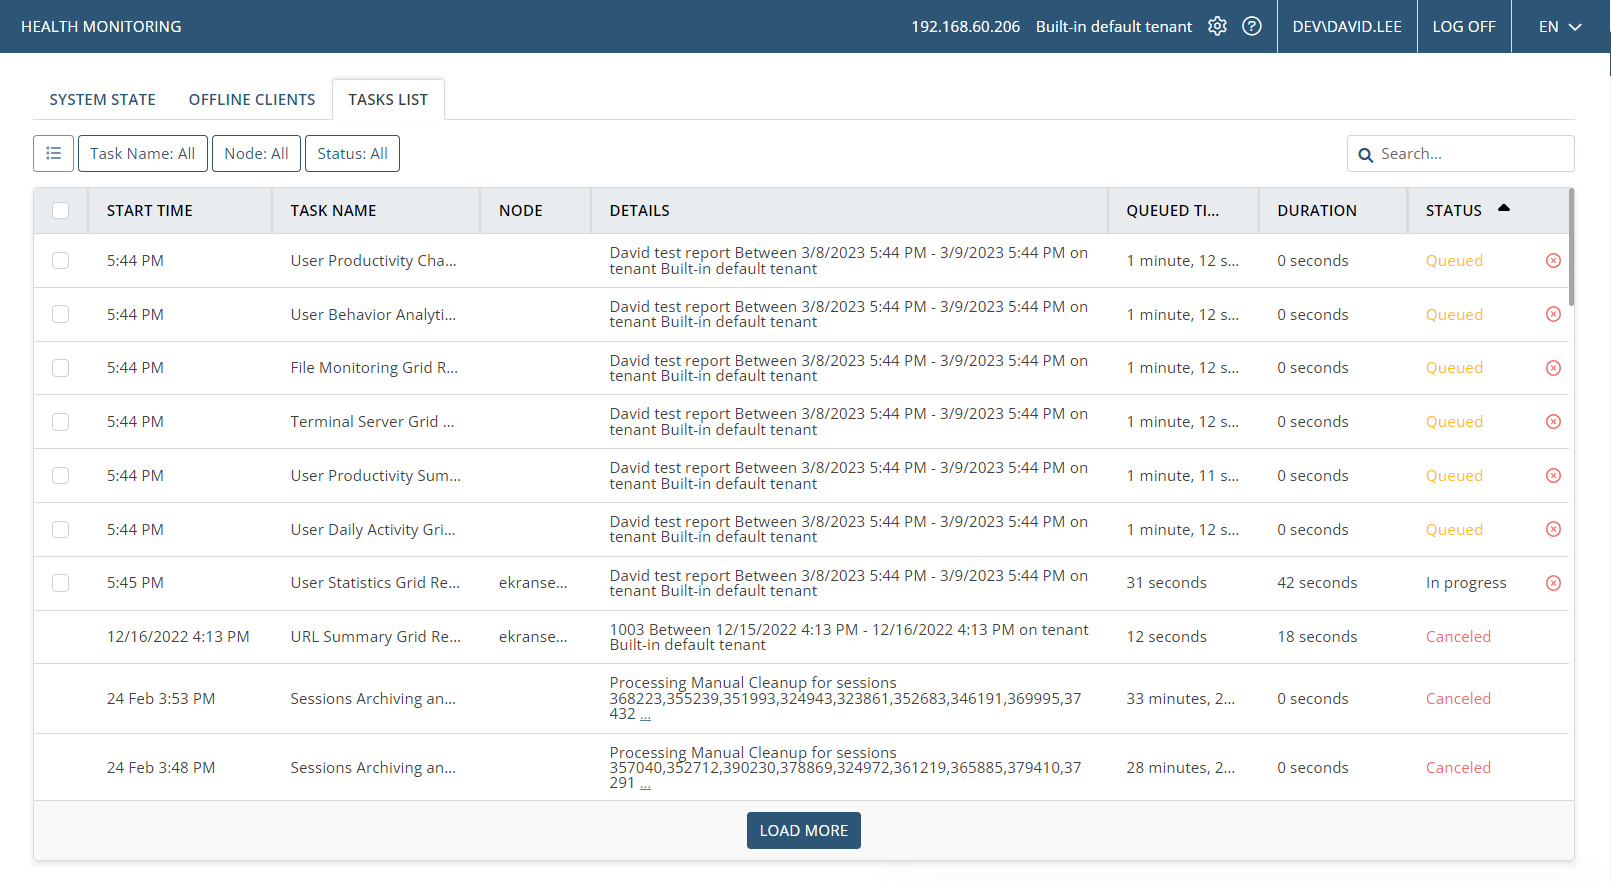
The Tasks List
The Tasks List tab (on the System Health page) allows information about tasks which may take significant time to process to be viewed (and canceled).
In Multi-Tenant mode, users can only view tasks for their own tenant.
To be able to view the Tasks List tab, a user needs to have both the administrative Management Tool Access permission and the administrative Client Installation and Management permission. To be able to cancel a task, the user must also have the administrative Database Management permission.
Tasks are displayed as records in the grid, and include the following task types:
• Scheduled (Archive &) Cleanup: A task of this type is added to the grid whenever a Scheduled Cleanup operation or Scheduled Archive & Cleanup operation is triggered (at the scheduled time and date), with a separate task added for each 10 Client sessions.
• Manual (Archive &) Cleanup: A task of this type is added to the grid whenever a one-time Cleanup operation or one-time Archive & Cleanup operation is run manually (by using the Run once option), with a separate task added for each 10 Client sessions.
• Scheduled report generation: A task of this type is added to the grid whenever a Scheduled Report rule is triggered at the scheduled time and date, with a separate task added for each Report Type defined in the rule.
• Manual report generation: A task of this type is added to the grid whenever one-time report is run manually (by using the Generate Report button on the Report Generator tab).
• Updating the Blocked Users list: A task of this type is added to the grid whenever the Blocked Users list is updated (i.e. whenever users are added to or removed from the blocked list).
• Forensic Export: A task of this type is added to the grid whenever a Forensic Export is run, with a separate task added for each Client session (or Client session fragment) exported.
The following information about tasks is displayed in the grid in the corresponding columns:
• Start Time: The time and date when execution of the task began (after being queued).
• Task Name, for example:
- For Scheduled (Archive &) Cleanup tasks: “Sessions Archiving and Cleanup”.
- For Manual (Archive &) Cleanup tasks: “Sessions Archiving and Cleanup”.
- For Scheduled report generation tasks: The name of the Report Type used to generate the report.
- For Manual report generation tasks: The name of the Report Type used to generate the report.
- For Updating the Blocked Users list tasks: “Updating Blocked Users list”.
- For Forensic Export tasks: “Forensic Export".
- For Account Discovery tasks: “Account Discovery".
• Node: The name of the computer that is processing / processed the task.
• Details, for example:
- For Scheduled (Archive &) Cleanup tasks:
- “Processing Scheduled (Archive &) Cleanup for sessions” and the session IDs of up to 10 processed Client sessions.
- The tenant affected.
- The Client groups affected.
- The Clients affected.
- For Manual (Archive &) Cleanup tasks:
- “Processing Manual (Archive &) Cleanup for sessions” and the session IDs of up to 10 processed Client sessions.
- The tenant affected.
- The Client groups affected.
- The Clients affected.
- For Scheduled report generation tasks:
- The name of the Scheduled Report rule used.
- The time period for which the report is generated.
- The tenant affected.
- For Manual report generation tasks:
- The time period for which the report is generated.
- The tenant affected.
- For Updating the Blocked Users list tasks:
- The Clients currently on the Blocked Users list (updated after the task is Finished).
- For Forensic Export tasks:
- The progress of the Forensic Export task (as a percentage of total task completion).
- For Account Discovery tasks:
- Whether the Account Discovery rule was run manually or automatically (Manual / Scheduled).
- The name (and type: Active Directory Discovery / Computer Discovery) of the Account Discovery rule run.
- The tenant in which the Account Discovery rule was run.
- The domain (as specified in the Source domain field when editing/adding an Account Discovery rule).
- The organizational units / groups in the domain (as specified in the Discover accounts from specific OUs / groups field when editing/adding and Account Discovery rule).
NOTE: For records where there is insufficient space to display all the data, all hidden data can be displayed by clicking "...", and hidden again by clicking “Hide”.
• Queued Time: The total time queued (before processing of the task).
• Duration: The total task execution time.
• Status: The current status of the task [Queued / In progress / Finished / Failed / Canceled] and:
- The Cancel icon (
NOTE: Multiple tasks can also be canceled simultaneously by selecting the checkboxes next to them on the left where available (or the 

- The Download Logs icon (
NOTE: The data displayed in the grid is updated automatically every 60 seconds (and the page can also be refreshed manually at any time by pressing the F5 key).
To adjust the width of the columns, place the cursor over the separators between the required column headers, and drag and drop the separator left or right, as required.
To sort the records, click the required column header. The column sort order can be changed from descending to ascending, or vice versa, by clicking the column header again, and is indicated by the up/down arrow icon in the column header. The default sort order is by the time in the Start Time column, with the most recently added record at the top.
NOTE: If the data is not sorted by a column, the Sort arrow is not shown in the column header.
To filter the records, click the required filter, and select one or multiple checkboxes as required. The data can be filtered by multiple filters simultaneously.
To search the records in the Details column, the 
To change the number of records displayed per page, click the Load More button at the bottom of the page to display an additional 50 records each time it is pressed.