
Viewing Reports Generated
Information about reports generated (both from Scheduled Report rules and by using the Report Generator) can be viewed in the grid displayed on the Generated Reports tab (on the Reports page).
On this tab, the reports generated can be downloaded, reports being generated can be canceled, and the records displayed in the grid can be deleted.
To be able to view the Generated Reports tab, a user needs to have the administrative Viewing Monitoring Results permission.
NOTE: In Multi-Tenant mode, users can only view reports for their own tenant.
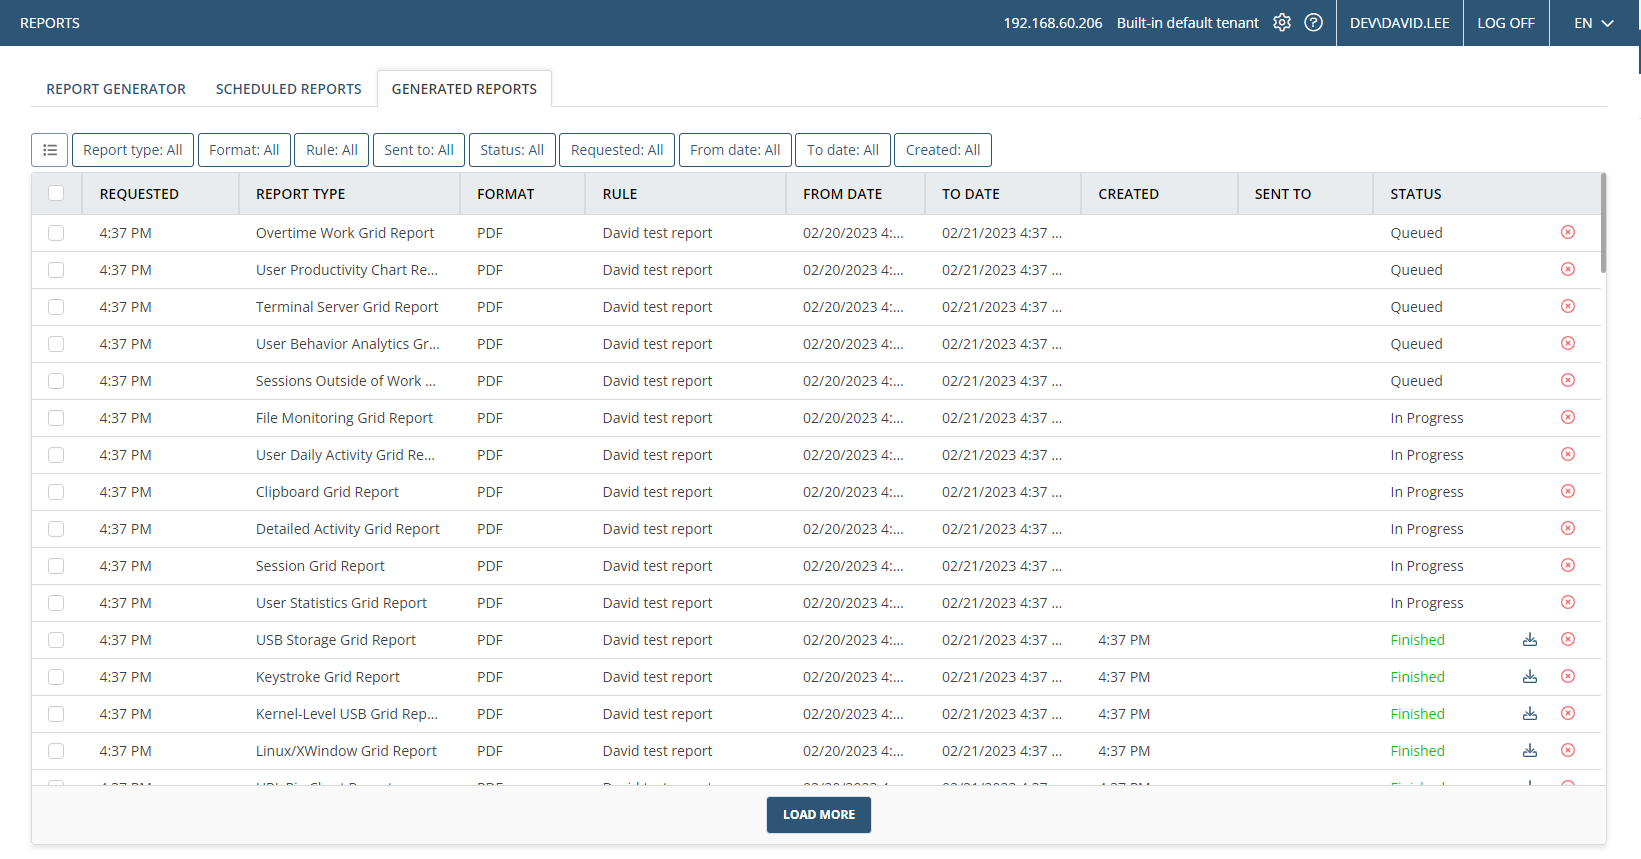
For each report generated (or being generated), a record is added to the grid, where the following information in displayed the corresponding columns:
• 
• Requested: The time and date when the report was requested/triggered (and the record was added to the grid).
• Report Type: The type of report generated (e.g. Alert Grid report, Activity Chart Report, etc).
• Format: The file format (e.g. PDF, CSV) of the report generated.
• Rule: The name of the Scheduled Report rule used to generate the report (this field is empty for reports generated manually on the Report Generator tab).
• From Date: The time and date of the start of the period for which the report is generated.
• To Date: The time and date of the end of the period for which the report is generated.
• Created: The time and date when generation of the report was completed.
• Sent To: The email address of the users that the report is emailed to for Scheduled Reports (this field is empty for reports generated manually on the Report Generator tab).
• Status: The current status of the report generation task [Queued / In Progress / Finished / Failed / Canceled].
• The Download (
NOTE: The Download icon is only displayed to users who are allowed to download and view the report, as specified in the "Who can download" section (in either the Report Generator or in the Scheduled Report rule) when the report was generated.
• The Cancel and remove (
NOTE: Multiple reports can also be canceled and deleted simultaneously by selecting the checkboxes next to them on the left (or the Select All (

NOTE: If the generation of a report which is "Queued" or "In progress" needs to be canceled without deleting the record from the grid, it can instead be cancelled on the Tasks List tab, on the System Health page, and the record will then remain displayed in both grids with the "Canceled" status.
NOTE: The data displayed in the grid is updated automatically every 60 seconds (and the page can also be refreshed manually at any time by pressing the F5 key).
To adjust the width of the columns, place the cursor over the separators between the required column headers, and drag and drop the separator left or right, as required.
To sort the records, click the required column header. The column sort order can be changed from descending to ascending, or vice versa, by clicking the column header again, and is indicated by the up/down arrow icon in the column header. The default sort order is by the time in the Requested column, with the most recently added record at the top.
NOTE: If the data is not sorted by a column, the Sort arrow is not shown in the column header.
To filter the records, click the required filter, and select one or multiple checkboxes as required. The data can be filtered by multiple filters simultaneously.
To change the number of records displayed per page, click the Load More button at the bottom of the page to display an additional 50 records each time it is pressed.