
Recent Alerts
The Recent Alerts dashboard contains a bar chart that displays information on alerts triggered within a specific time period.
The dashboard is updated every 15 minutes.
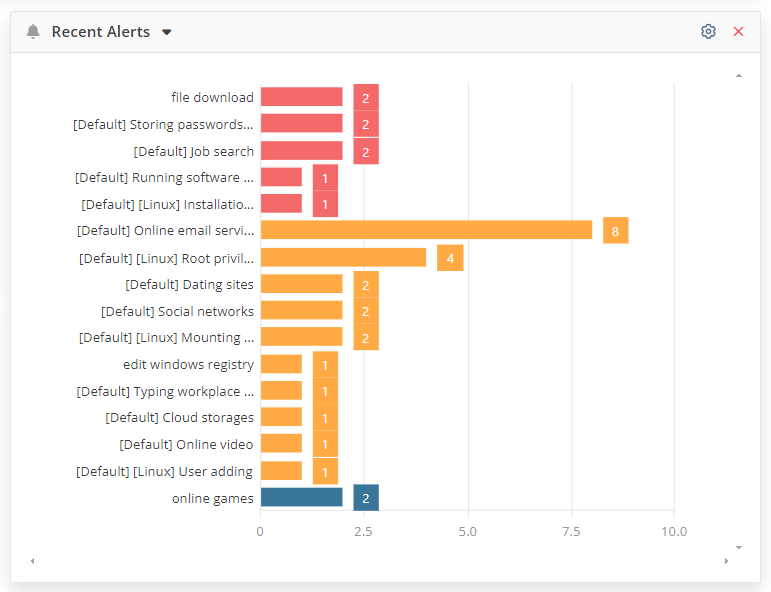
Each bar in the chart corresponds to an enabled alert (that was triggered at least once during the specified time interval).
The length of each bar indicates the number of notifications received (i.e. the number of alert events that occurred) due to the corresponding alert being triggered, during the specific time interval.
The color of each bar corresponds to the alert risk level, which is by default:
• Alerts with the Critical risk level are displayed in red.
• Alerts with the High risk level are displayed in orange.
• Alerts with the Normal risk level are displayed in blue.
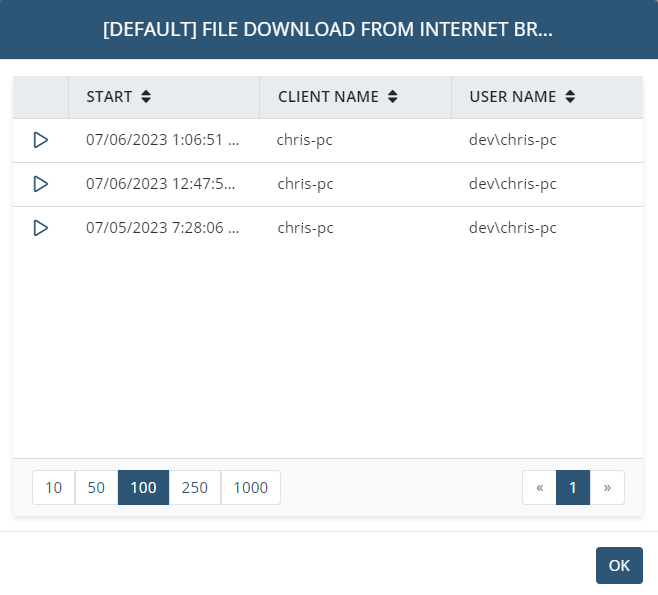
To view detailed information on the alert events, click the required bar, and the following information is displayed in the pop-up window that opens:
• Play: Click the 
• Start: The time at which the alert was triggered.
• Client Name: The name of the Client machine (on which the alert was triggered).
• User Name: The user name of the user logged in to the Client machine (who triggered the alert).
The following settings can be configured for this dashboard, by clicking the cog (
• Period: The time interval for which the alerts are selected.
• Sort type: The category by which the alerts are sorted:
- Count: Allows sorting of the alerts by the number of alert notifications.
- Alphabetic: Allows sorting by the alert name.
• Sort direction: The order in which the alerts are listed.
• Critical risk level: The color of the bars for alerts with the Critical risk level.
• High risk level: The color of the bars for alerts with the High risk level.
• Normal risk level: The color of the bars for alerts with the Normal risk level.
Only information about Clients that the user has the Viewing Monitoring Results permission for Clients for is displayed on the dashboard. If you do not have this permission for any of the Clients, you will see an empty dashboard with a message saying that you do not have the permissions required for viewing this data. Also in this case, the dashboard will not be displayed in the drop-down list when clicking the Add button (in the top right of the page).