
Dashboards (on the Dashboards Page)
The Dashboards page is used to view various types of BI (business intelligence) dashboards for a specified date range, where each dashboard displays various measures of user productivity by using the data recorded by Ekran System while monitoring user activity on the endpoint Client computers.
These productivity dashboards are displayed in the form of convenient, interactive and individually-customizable charts (and are similar to when importing data from Ekran System into Power BI report templates by using the Ekran System API Data Connector).
NOTE: A Management Tool user needs to have the administrative Viewing Monitoring Results permission to access the Dashboards page, and only information on the Clients that the user has the Viewing Monitoring Results permission for Clients for is displayed in the productivity dashboards.
NOTE: For best performance of the productivity dashboards, if used, the PostgreSQL database needs to be updated to version 13 or higher.
Table of Contents
1. Customizing All the Dashboards
To customize the global filter settings (i.e. in all the productivity dashboards on the page at once), do the following:
1. Click the Dashboards navigation link (on the left).
2. On the Dashboards page that opens, click the global Filter Settings (
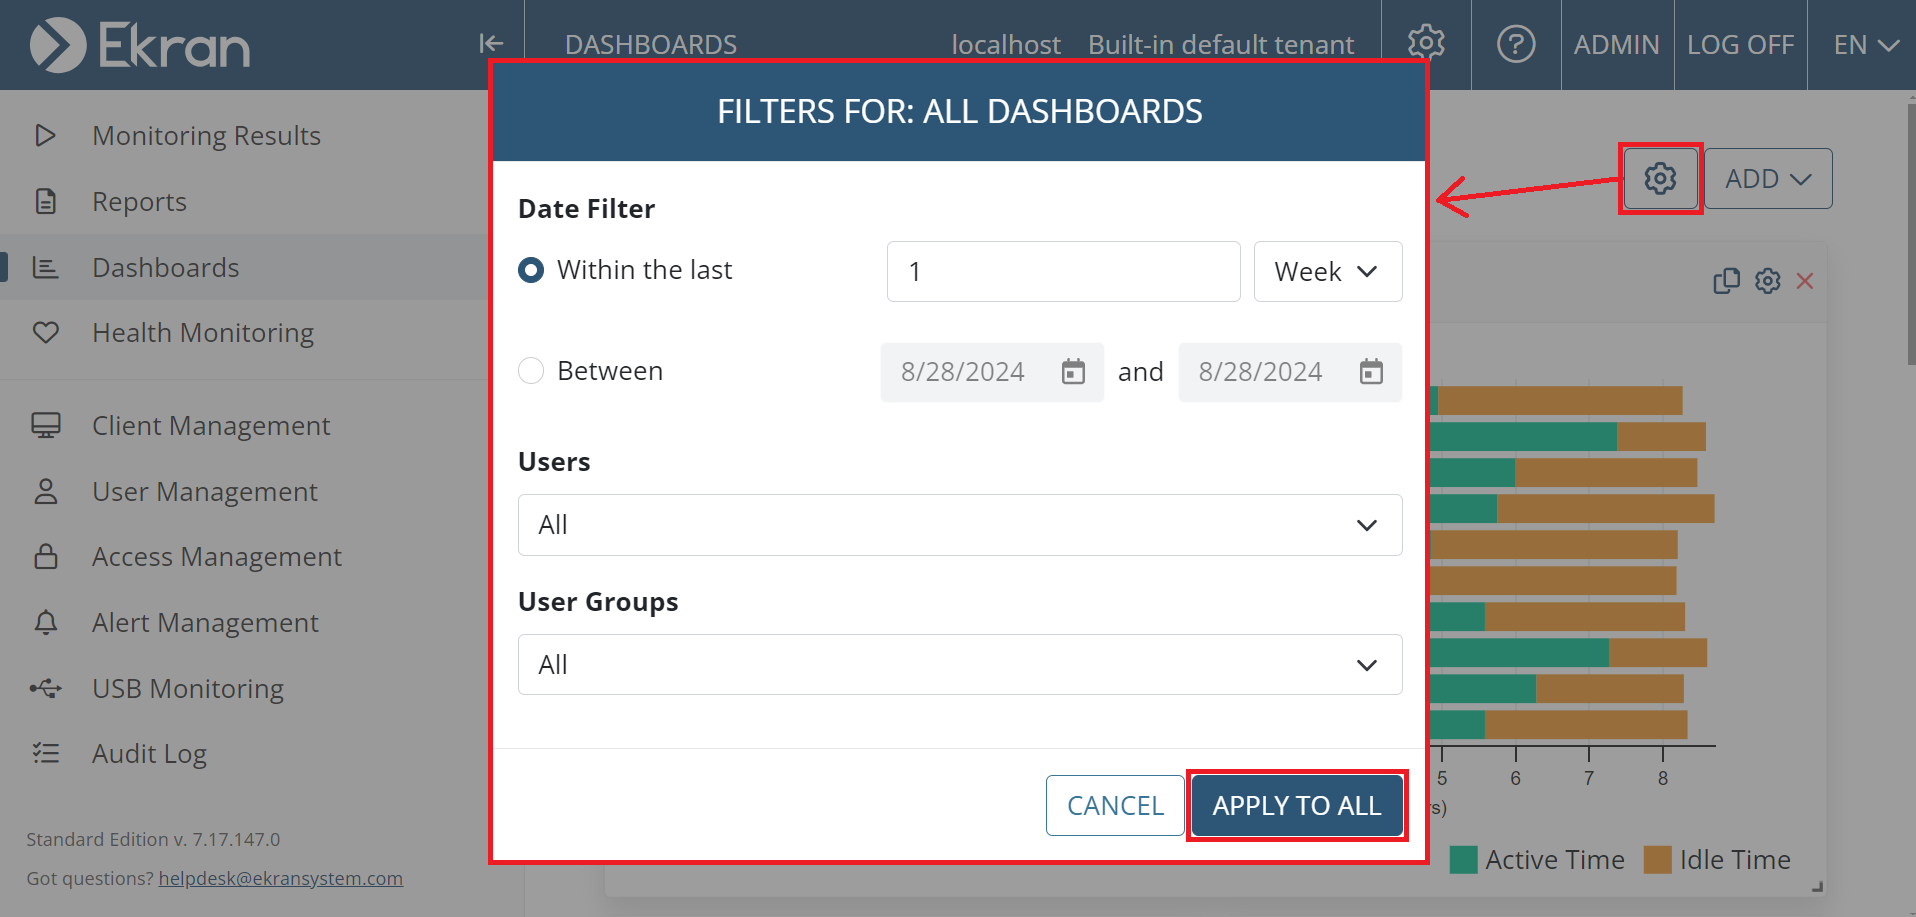
3. In the pop-up window that opens, in the Date Filter section, select either the Within the last or Between radio button and the required global date range (i.e. the date range for all the dashboards on the page), as well as the Users and User Groups required, and then click the Apply to All button.
4. The new filter settings are then applied to all the dashboards on the page.
5. Then click the Filter Settings (
2. Customizing Individual Dashboards and the Page Layout
To customize the filter settings in any individual productivity dashboard so as to modify the range of data specified in it, click the Filter Settings (
• Date Filter: To modify the date range as required (either within or outside of the values specified in the global filter settings).
• [For the "Total Idle Time vs Active Time" dashboard type only:] Report Level: To select either User or User Group to specify which of these will be represented by each bar displayed in the bar chart.
• User: To search for and select only specific users to be included i.e. to be displayed as separate bars in the bar chart (or if User Group is selected in the Report Level drop-down list above, all the user groups that the selected users are in will be included as separate bars in the bar chart).
• User Group: To search for and select only specific user groups to be included i.e. to be displayed as separate bars in the bar chart (or if User is selected in the Report Level drop-down list above, all the users in the selected user groups will be included as separate bars in the bar chart).
NOTE: The filter settings in individual dashboards are independent of the global filter settings (i.e. the filter settings for all dashboards at once), and can therefore be modified to be either within (i.e. a subset of) or outside of (i.e. a wider range than in) the values specified in the global filters settings.

To rename a dashboard, click the Edit (
To resize a dashboard, drag & drop the bottom right corner of the dashboard as required.
To rearrange the layout of the dashboards on the page, drag & drop the dashboard header to the location required.
To hide a dashboard (i.e. remove it from the page), click the Remove (
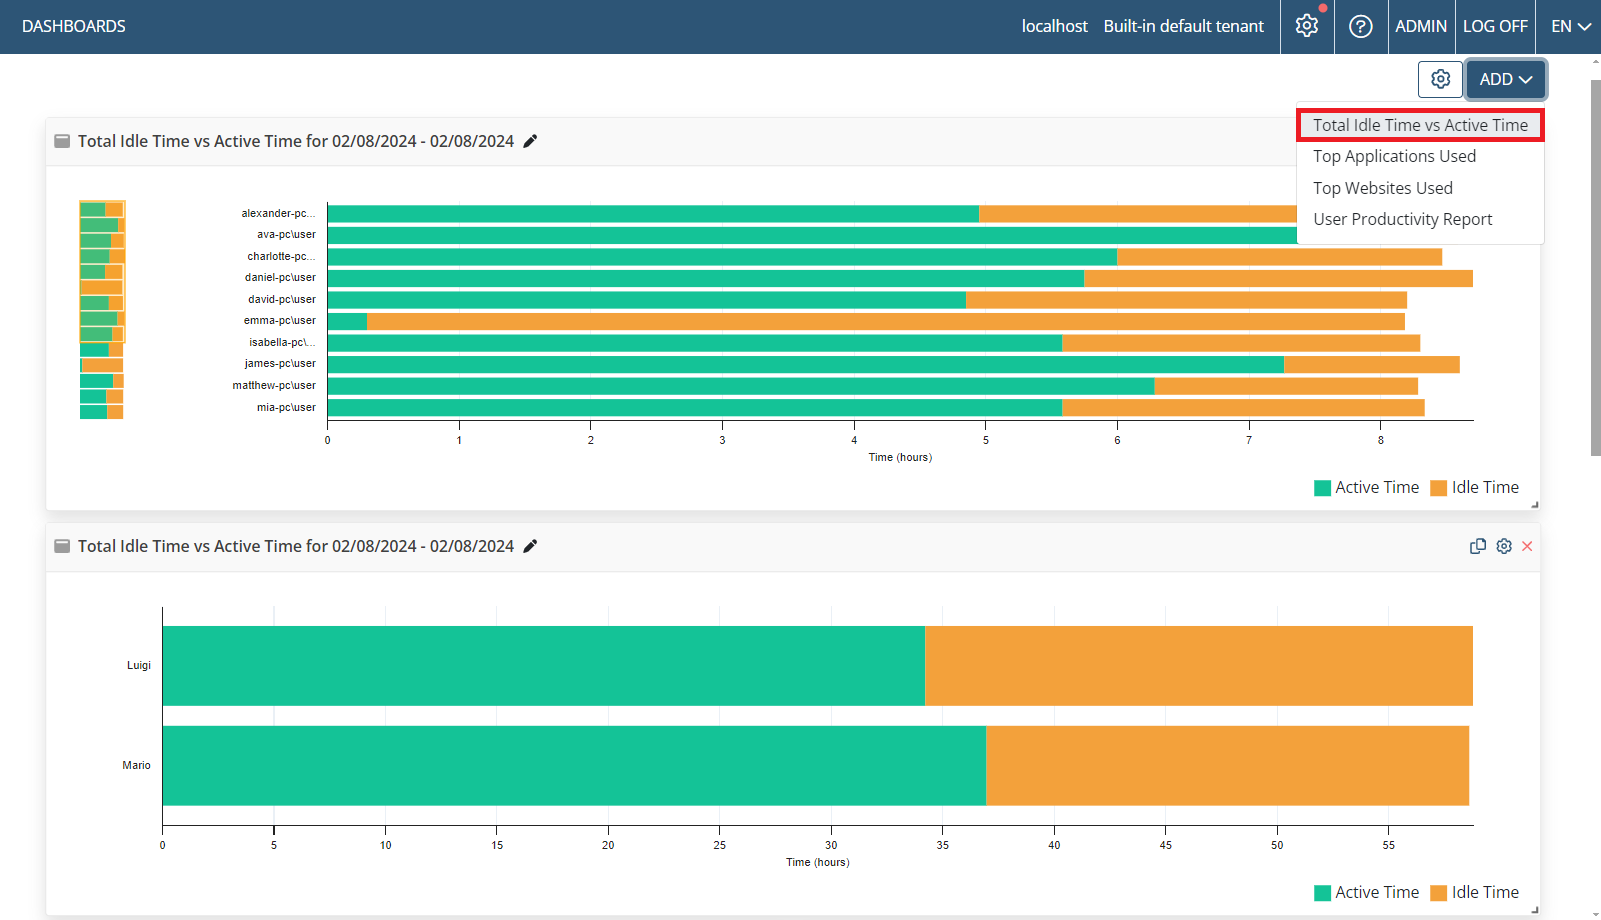
To add a dashboard to the page (where a maximum of 10 dashboards can be added and displayed on the page at any one time, including multiple dashboards of the same type, and then customized in the filter settings of each one individually), either:
• Click the Add button (in the top right of the page), and then select the type of dashboard to be added.
• Click the Copy (
3. Types of Dashboards
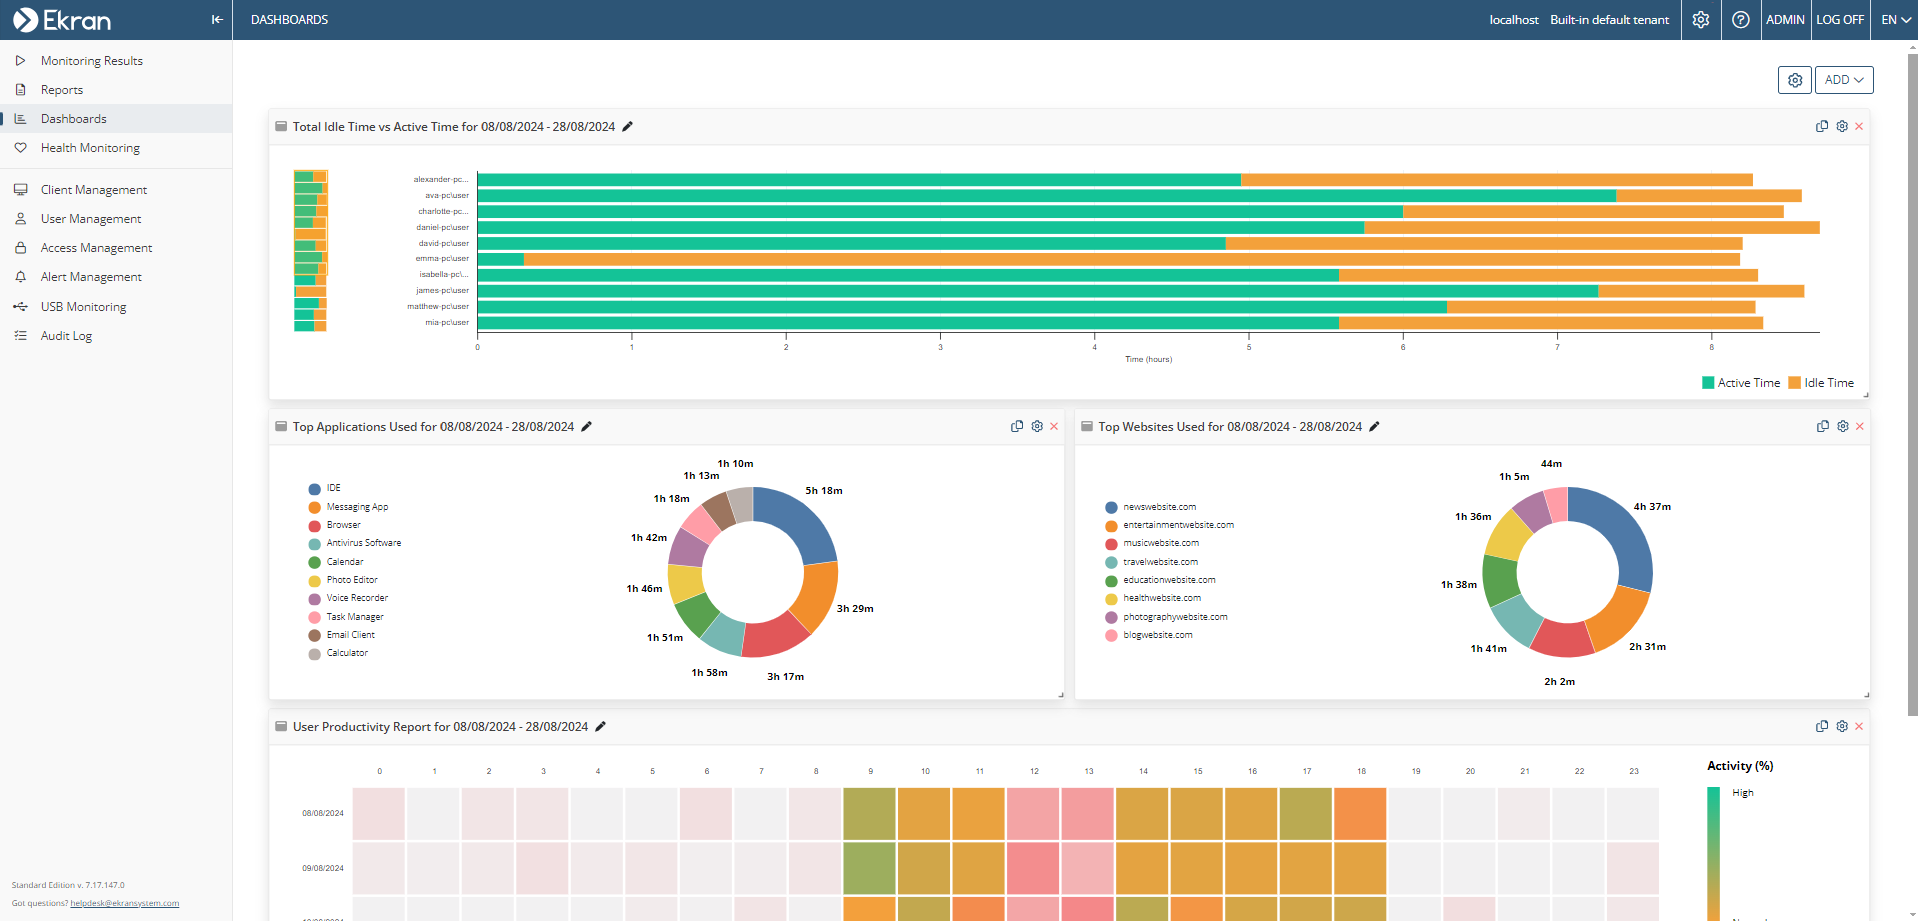
One of each of the 4 different types of productivity dashboards described below are displayed on the page by default.
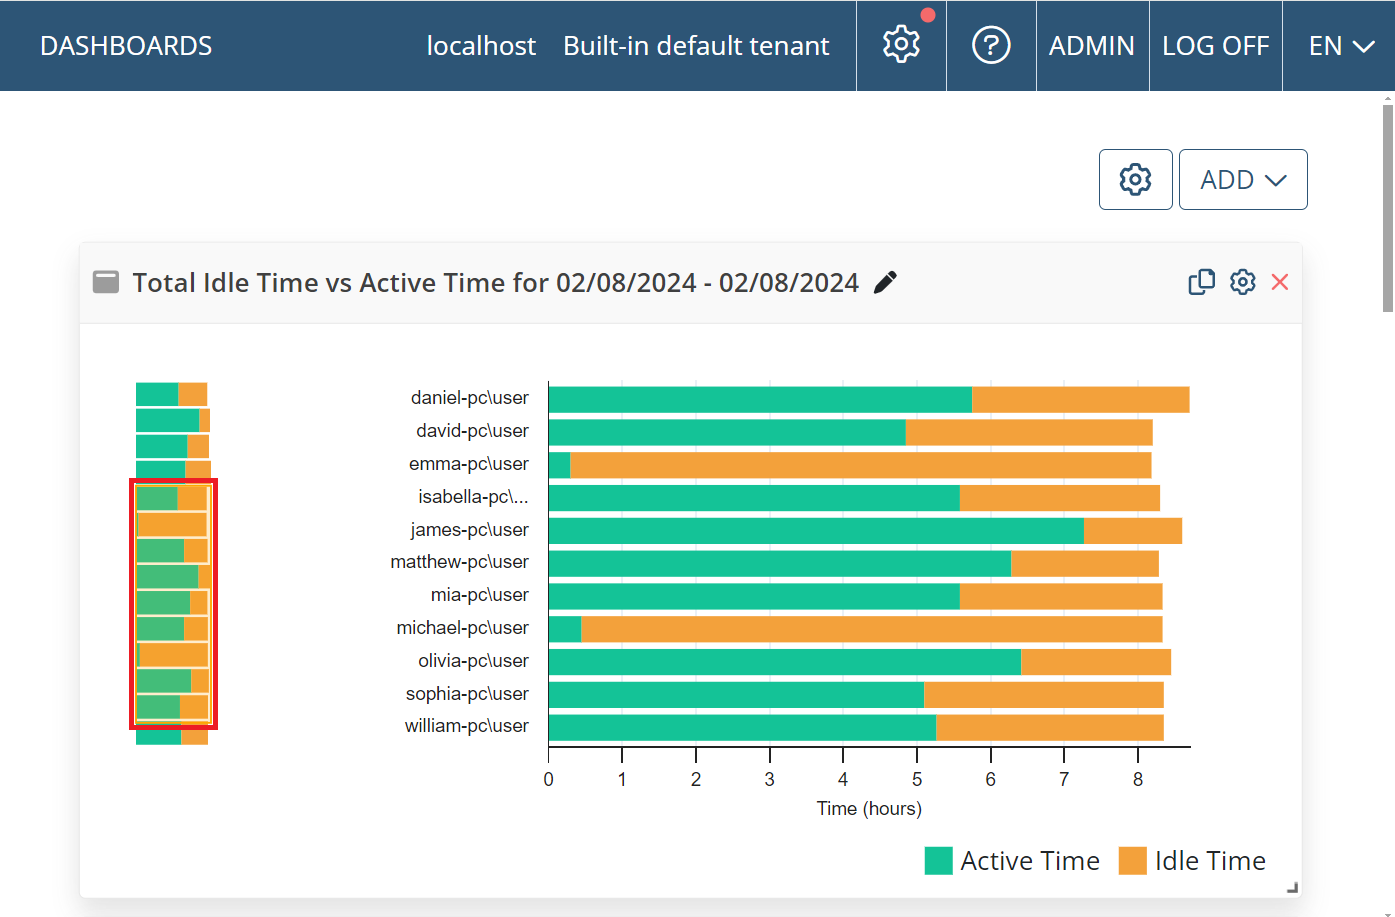
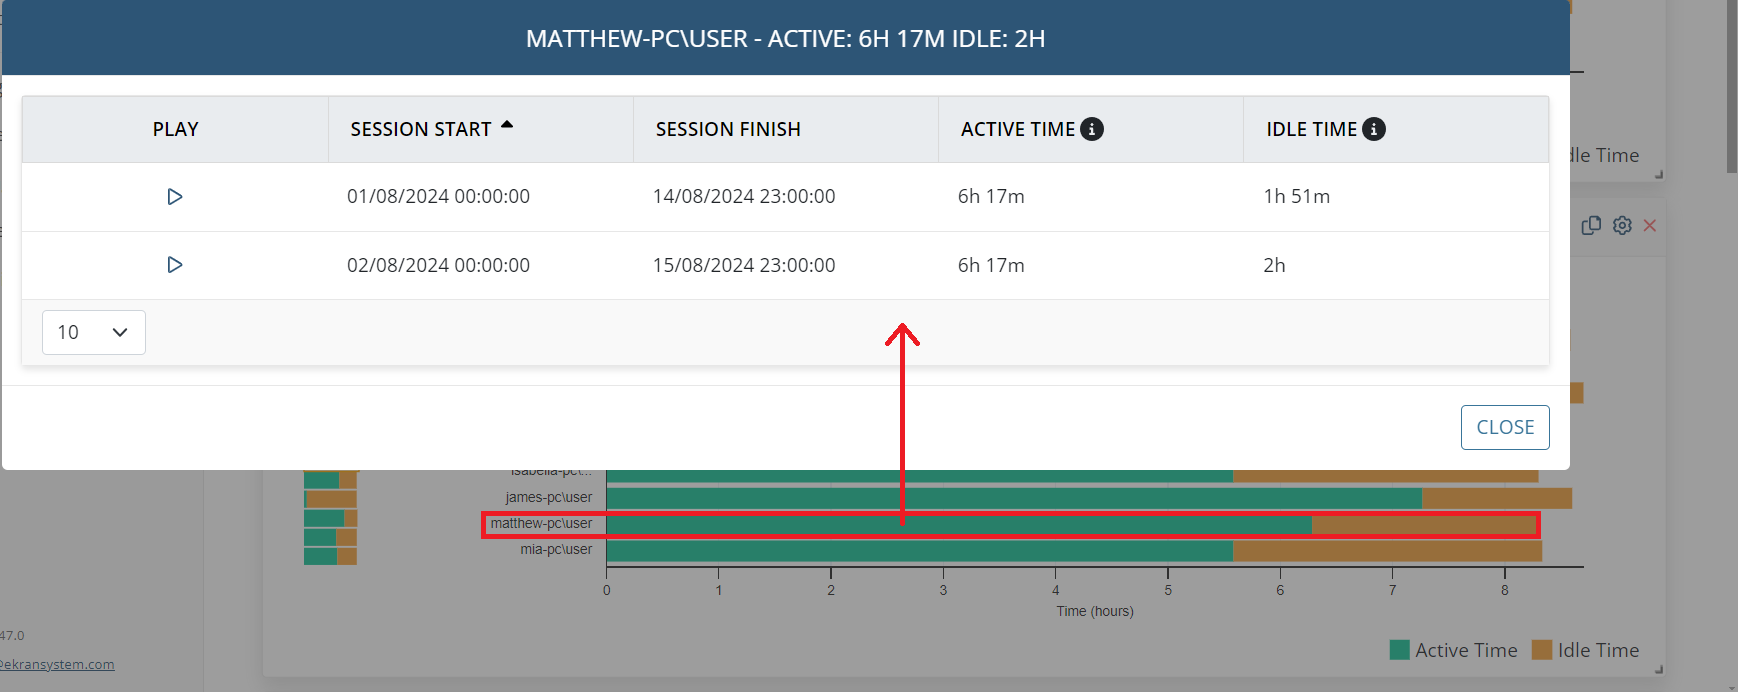
3.1. Total Idle Time vs Active Time: A bar chart showing an overview of the Total Active Time to the Total Idle Time ratio for each user (or for all the users in each user group) selected, i.e. an overview of how much time each user (or all the users in each user group) selected actively interacted with their computers versus how much time each user (or all the users in each user group) selected has (have) been idle, in all their sessions in the date range selected.
A maximum of the first 10 users / user groups are displayed, where if there are more that 10, a vertical slider is also displayed (on the duplicated mini-bar chart on the left of the main bar chart) which can be used to navigate to display the other users / user groups by dragging & dropping the slider up and down.
NOTE: The "Total Active Time" for a session is calculated as the "Total Session Time" minus the "Total Idle Time".
To view detailed information about all the sessions for any user / user group displayed in the bar chart, click on the required bar to open a popup window (where the Play (
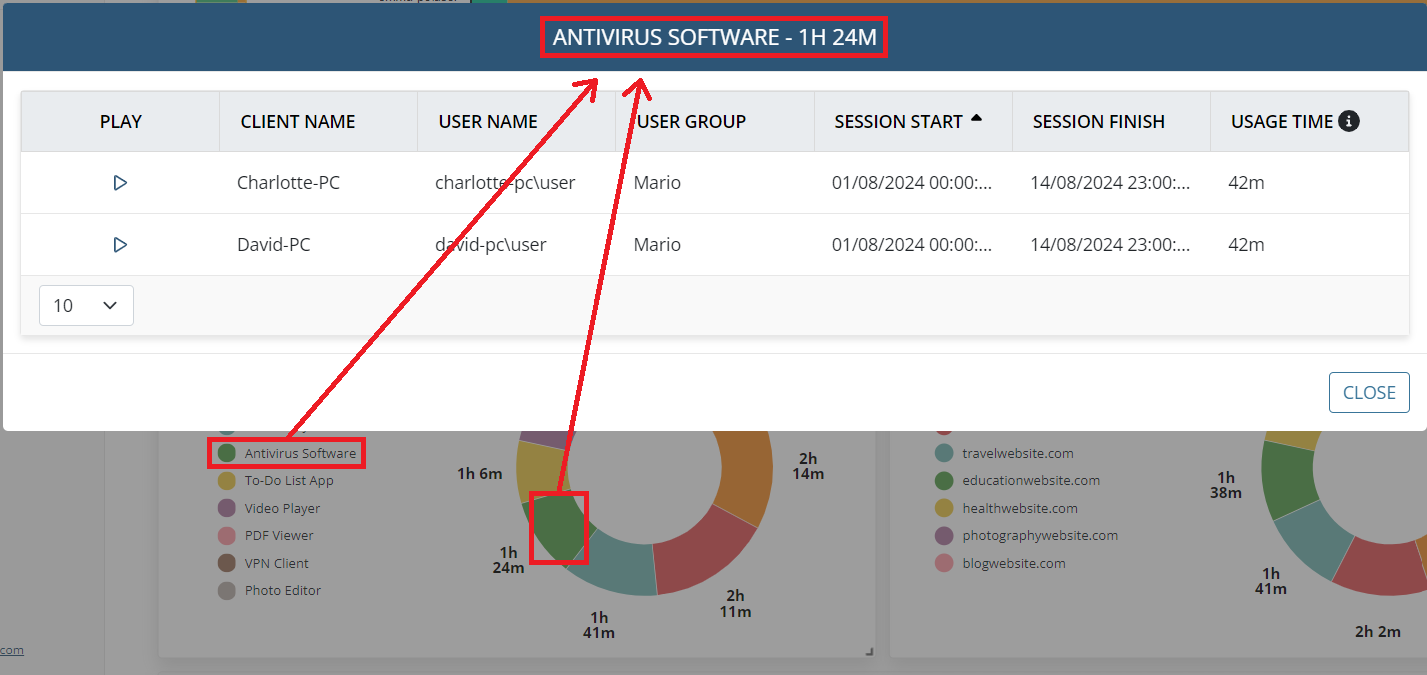
3.2. Top Applications Used: A pie chart showing the top 10 applications with the longest total time used by all the users (and/or by all the users in the user groups) selected, in all their sessions in the date range selected.
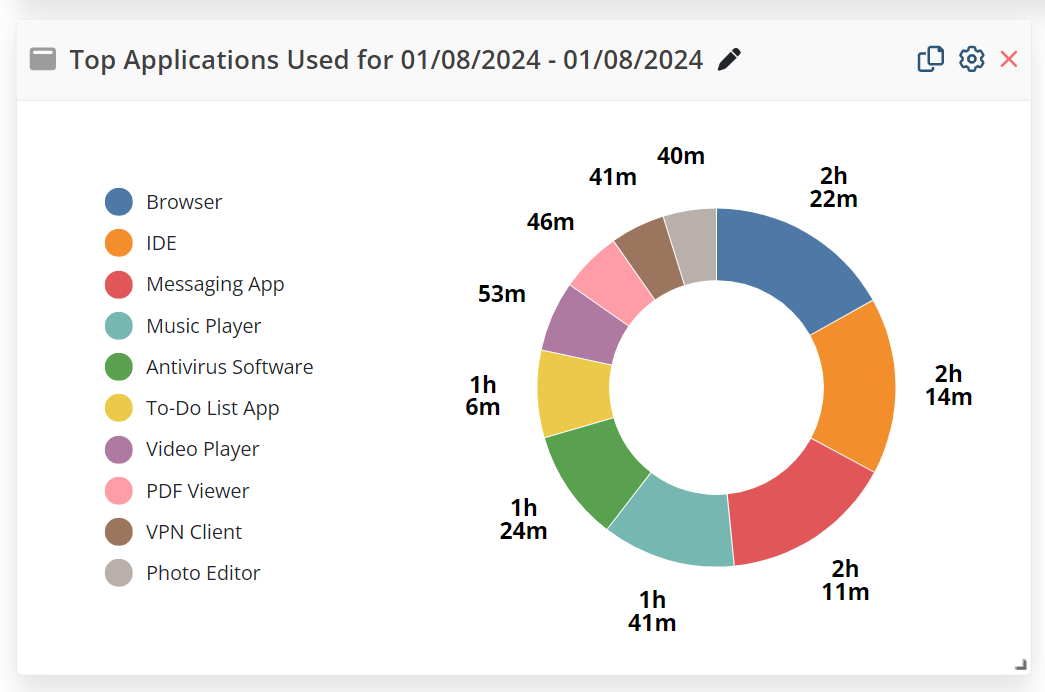
To view detailed information about all the sessions for any application displayed in the pie chart, click on the required segment or application name to open a popup window (where the Play (
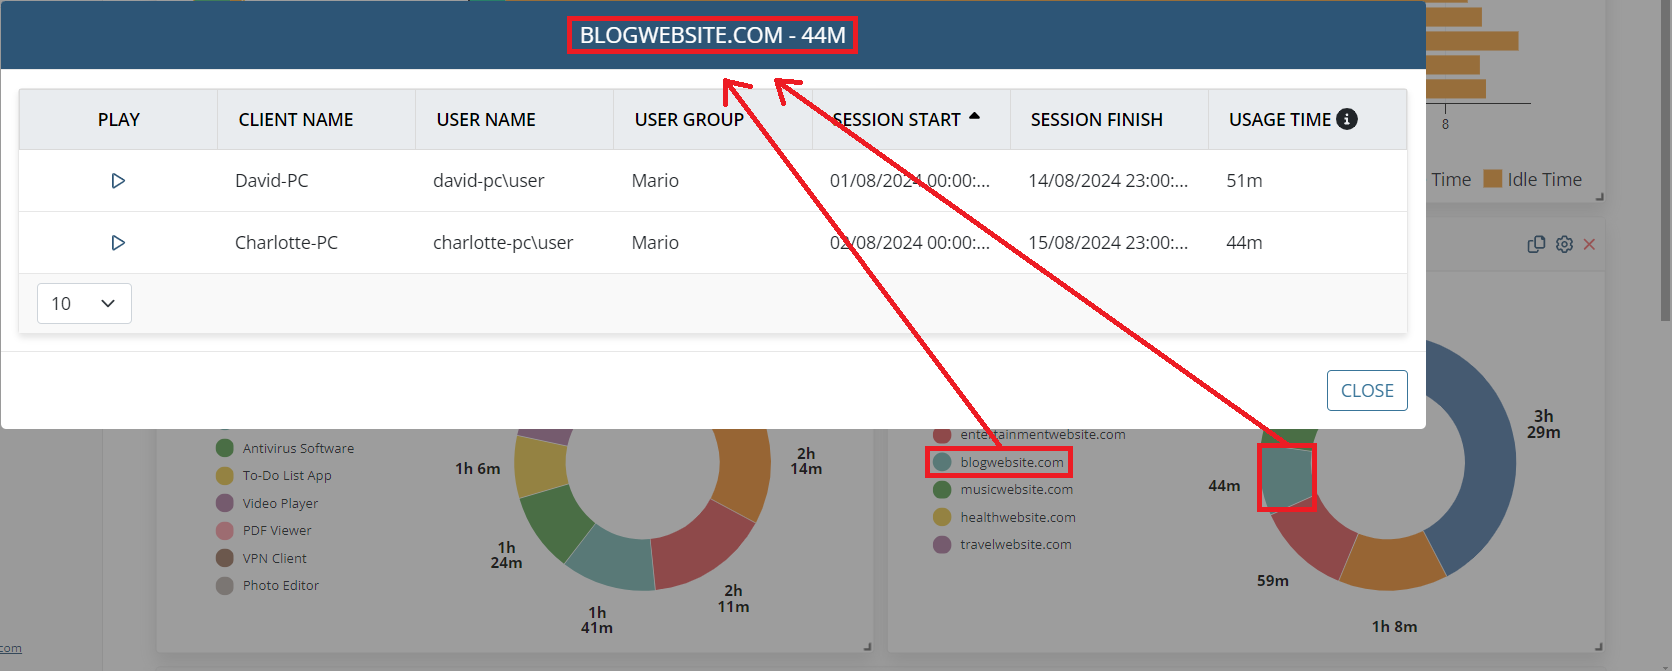
3.3. Top Websites Used: A pie chart showing the top 10 websites with the longest total time spent visiting them by all the users (and/or by all the users in the user groups) selected, in all their sessions in the date range selected.
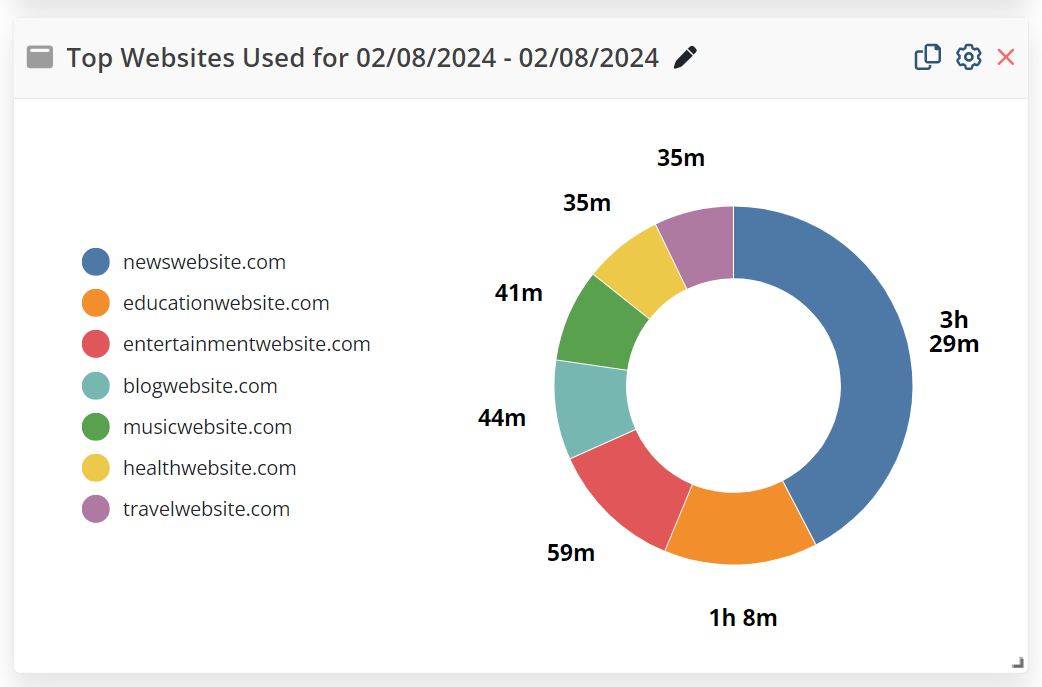
NOTE: All webpages viewed with lower-level domain names (i.e. after the first "/" character) are included in the top-level domain names shown in the chart.
NOTE: URL monitoring is only currently implemented for Windows and macOS Clients.
To view detailed information about all the sessions for any website displayed in the pie chart, click on the required segment or website name to open a popup window (where the Play (
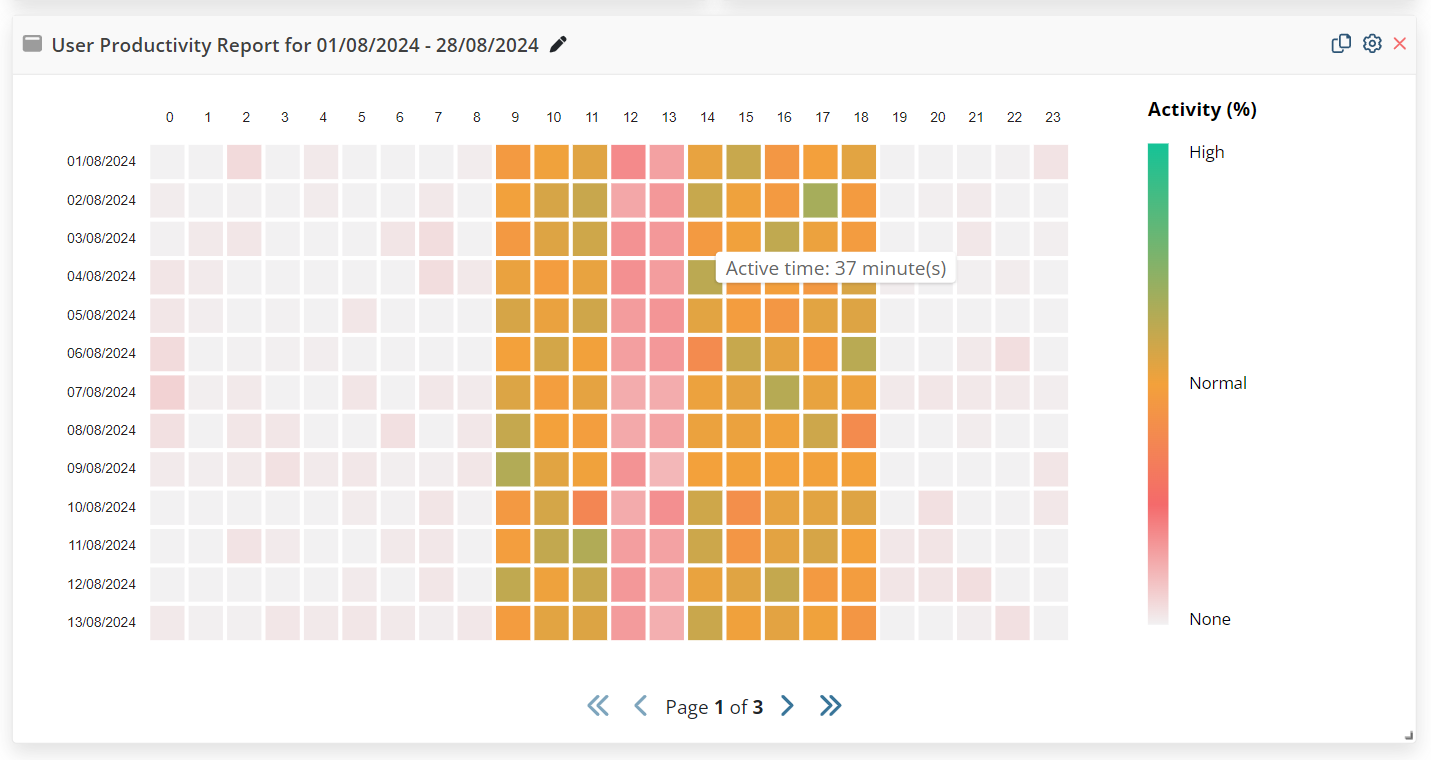
3.4. User Productivity Report: A heatmap chart showing which hours of the day users were on average at their most productive i.e. showing the Average Active Time in minutes for each hour of each day for all the users (and/or for all the users in the user groups) selected, in all their sessions in the date range selected, where:
• Each row represents a day in the date range selected (with the first day shown in the top row).
• In each row, each of the 24 cells represent an hour in the day (with the first hour starting at midnight shown in the "0" column), where each cell is color-coded based on the number of active minutes in the hour (see the Activity (%) key displayed on the right).
Example calculation: An example of the calculation of Average Active Time is as follows: The dashboard is filtered to show the activity of users Ann Atkins, Ben Bull, and Cathy Cole. From 9:00am until 10:00am, the Total Active Time of Ann Atkins is 10 minutes, of Ben Bull is 15 minutes, and of Cathy Cole is 35 minutes. Therefore, the Average Active Time for this hour for all three users is (10 + 15 + 35) / 3 = 20 minutes.
NOTE: The "Total Active Time" for one user for one hour is calculated as one hour minus the "Total Idle Time".
To view the Average Active Time for any hour, hover over the corresponding cell to display a hint.
To view the data for all the days in the date range, navigate between multiple pages by clicking on the First Page, Previous Page, Next Page, Last Page (